


_06_19_2026_12_34_15_139937.jpg)

PCF Group PLC (LON:PCF)
Incepted in 1994, AIM-listed, PCF Group Plc is the parent company of PCF Bank Limited. In 2017, the group acquired a banking license to commence operations as a bank, since then, the company has increased its lending portfolio significantly. The bank currently sources funds by offering individuals with retail savings products and then deploys these funds to its lending divisions. The company provides finance for vehicles, plant and equipment to SMEs through its Business Finance division. The company provides finance for motor vehicles through its Consumer Finance division. The company provides loans to sole traders and companies for investing in residential property through its Property finance division. The company also provides finance to the broadcast and media industry through Azule Limited, a company owned by PCF Bank.
PCF-Business performance for FY19 period ended 30th September 2019
(Source: London Stock Exchange)
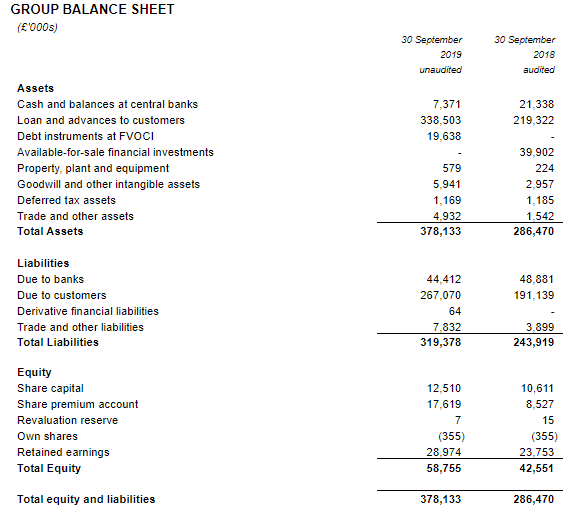
The companyâs operating income was up by 51 per cent to £22.2 million in FY19 from £14.7 million in FY18. The companyâs statutory profit before taxation was up by 54 per cent to £8.0 million in FY19 from £5.2 million in FY18. The companyâs earnings per share were up by 35 per cent to 2.7 pence in FY19 as compared to 2 pence in FY18. The company generated a Return on assets of 2.9 per cent in FY19. The company proposed a final dividend of 0.4 pence in FY19 which shall be payable to shareholders on 9th April 2020. The companyâs Net Interest Margin was reduced to 7.8 per cent in FY19 from 8.2 per cent in FY18, as the company actively continued to lend throughout the period. The companyâs portfolio grew by 55 per cent to £339 million in FY19, was in line with the companyâs growth policy versus £219 million in FY18. The companyâs deposit base from retail customers grew to £267 million in FY19 from £191 million in FY18. The retail deposit customers grew to 6,250 in FY19 from 4,500 in FY18.
PCF-Stock price performance
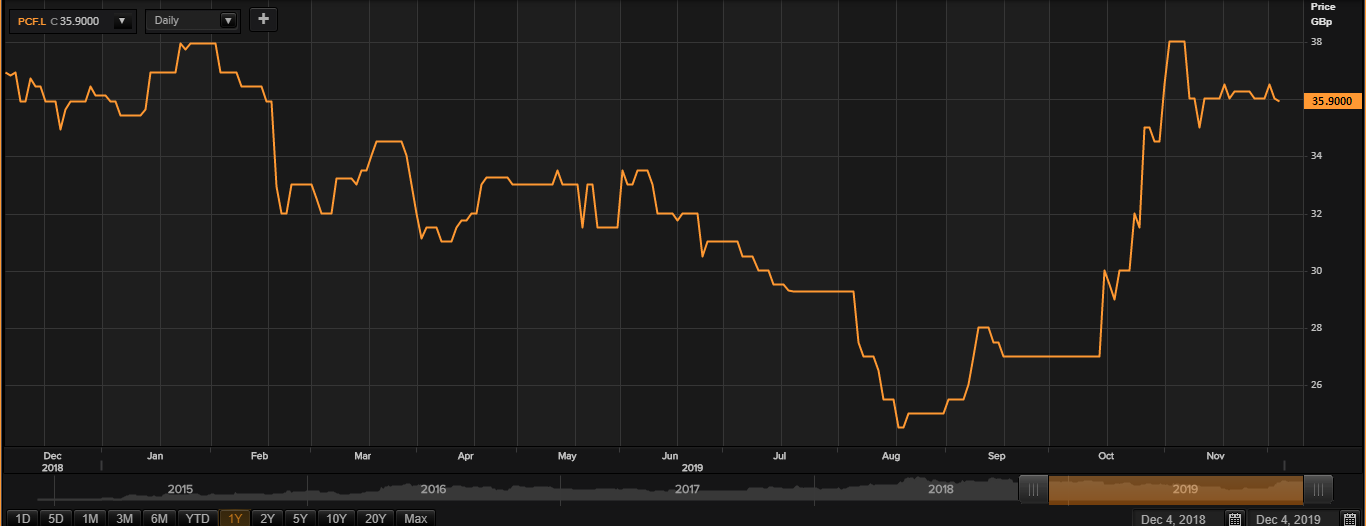
(Source: Thomson Reuters) Daily Chart as on 04th-December-19, prior to the close of the market
On 4th December 2019, at 10:23 A.M GMT, while writing, PCF Group PLCâs share price was reported to be trading on the London Stock Exchange at GBX 35.90 per share, an decrease of 0.27 per cent or GBX 0.10 per share, as compared to the previous dayâs closing price, which was reported to be at GBX 36.00 per share. At the time of reporting, PCF Group PLCâs stock was reported to be trading 50.27 per cent above the 52-week low share price, which was at GBX 23.89 per share, that the companyâs shares reached on August 19, 2019. The companyâs total market capitalisation (M-Cap) was reportedly valued to be at GBP 90 million with respect to the shareâs current market price.
The PCF Group PLCâs share has given a positive return in the last three months in the value, of around 41.18 per cent. PCF Group PLCâs share generated a dividend yield of 0.83 per cent.
The beta of the PCF Group PLCâs share has been reported to be at negative 0.07. This basically implies that the volatility in the price of the companyâs stock is opposite to the volatility in the movement of the comparative benchmark index.
IXICO PLC (LON:IXI)
IXICO PLC aims for medical advancement and improving the health of people by finding insights regarding neuroscience and rare diseases from the data captured by deploying Artificial Intelligence (AI) in clinical development. The adoption of breakthrough data analytics by the company in precision healthcare will boost R&D productivity. The company analyses brain scans and digital biosensor data to enable better trial design, patient selection across all phases of clinical evaluation through the deployment of novel AI algorithms.
IXI-Business performance for FY19 period ended 30th September 2019
(Source: London Stock Exchange)
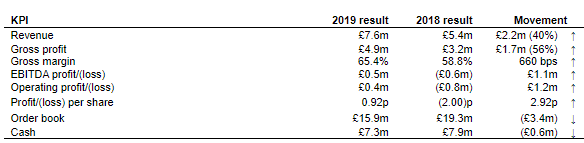
Since the company got quoted at the AIM, the company saw its first year of profitability in FY 19. The companyâs revenue grew by 40 per cent to £7.6 million in FY19 from £5.4 million in FY18. The gross margin of the company was up by 660 basis points to 65.4 per cent in FY19 from 58.8 per cent in FY18. The companyâs EBITDA profit stood at £0.5 million in FY19 as compared to a loss of £0.6 million in FY18, as a result of controlled administrative costs and operational leverage. The company generated an operating profit of £0.4 million in FY19 as against a loss of £0.8 million in FY18. This year, the Profit per share stood at 0.92 pence as compared to a loss of 2.0 pence per share in FY18. The company had cash balances of £7.3 million by the end of FY19.
The company possesses a healthy contracted order book worth £15.9 million in FY19 with further contracts signed post period. BGF Investment Management and Canaccord Genuity Group are the two new institutional investors of the company.
 IXI-Stock price performance
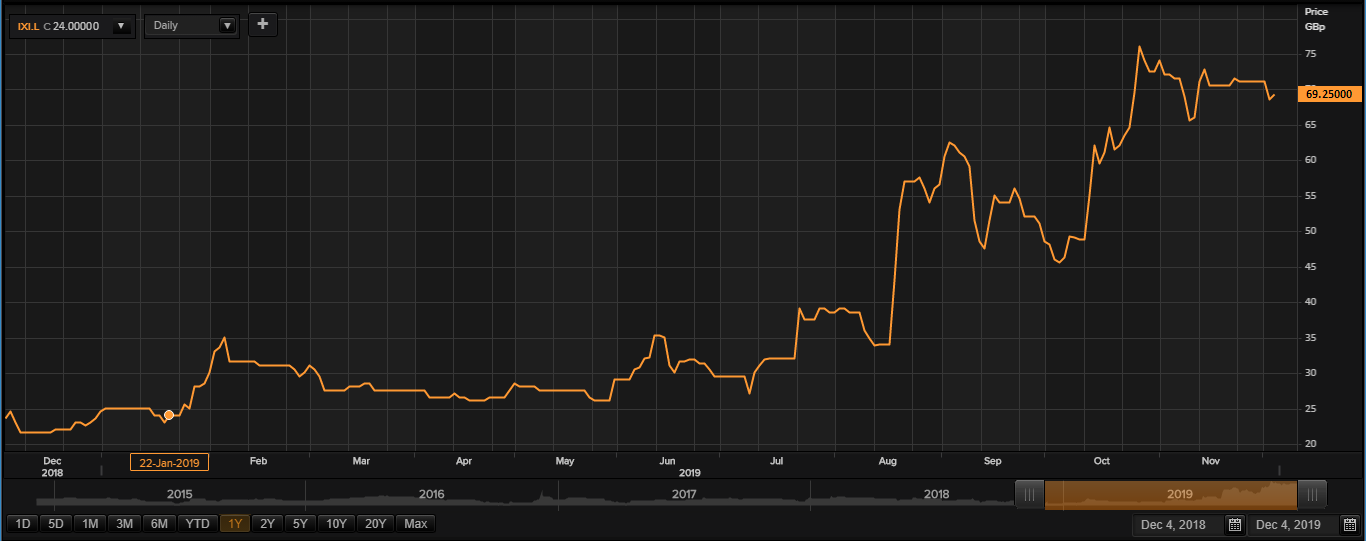
(Source: Thomson Reuters) Daily Chart as on 04th-December-19, prior to the close of the market
On 4th December 2019, at 10:29 A.M GMT, while writing, IXICO PLCâs share price was reported to be trading on the London Stock Exchange at GBX 69.25 per share, an increase of 1.09 per cent or GBX 0.75 per share, as compared to the previous dayâs closing price, which was reported to be at GBX 68.50 per share. At the time of reporting, the IXICO PLCâs share was reported to be trading 268.74 per cent above the 52-week low share price, which was at GBX 18.78 per share, that the companyâs shares reached on December 11, 2018. The companyâs total market capitalisation (M-Cap) was reportedly valued to be at GBP 32.13 million with respect to the shareâs current market price.
The IXICO PLCâs share has given a positive return in the last three months in the value, of around 13.22 per cent. IXICO PLCâs share generated a return of 191.49 per cent in value, in the last one year.
The beta of the IXICO PLCâs share has been reported to be at 0.122. This basically implies that the volatility in the price of the companyâs stock is less than the volatility in the movement of the comparative benchmark index.Â
SDCL Energy Efficiency Income Plc (LON:SEIT)
Headquartered in London, SDCL Energy Efficiency Income Trust plc is a pioneer company, which invests exclusively in the energy efficiency sector. The company invests in heating/cooling combined, and power plants combined projects and other energy efficiency projects in the United Kingdom and the United States. The company is governed and supervised by the Financial Conduct Authority in the United Kingdom. The company has representative offices in Dublin, Singapore and New York.
SEIT-Business performance for H1 FY20 period ended 30th September 2019
(Source: London Stock Exchange)
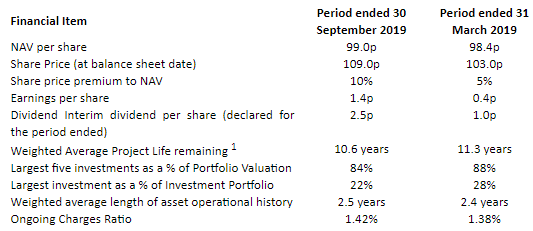
The companyâs total income was recorded at £3,598 thousand in H1 FY20. The companyâs NAV per share increased to 99 pence on 30th September 2019 from 98.40 pence on 31st March 2019. The companyâs Earnings per share stood at 1.4 pence in H1 FY20. The company made new acquisitions of £19.5 million during the period. The company raised £72 million in April 2019 with proceeds intended for new investments. The companyâs portfolio value increased to £81.3 million on 30th September 2019 from £60.9 million as on 31st March 2019. The company had cash balances of £89 million by the end of H1 FY20. The company declared a dividend of 2.5 pence per share for H1 FY20 and targeted aggregate dividend of 5 pence per share for FY20.
SEIT-Stock price performance
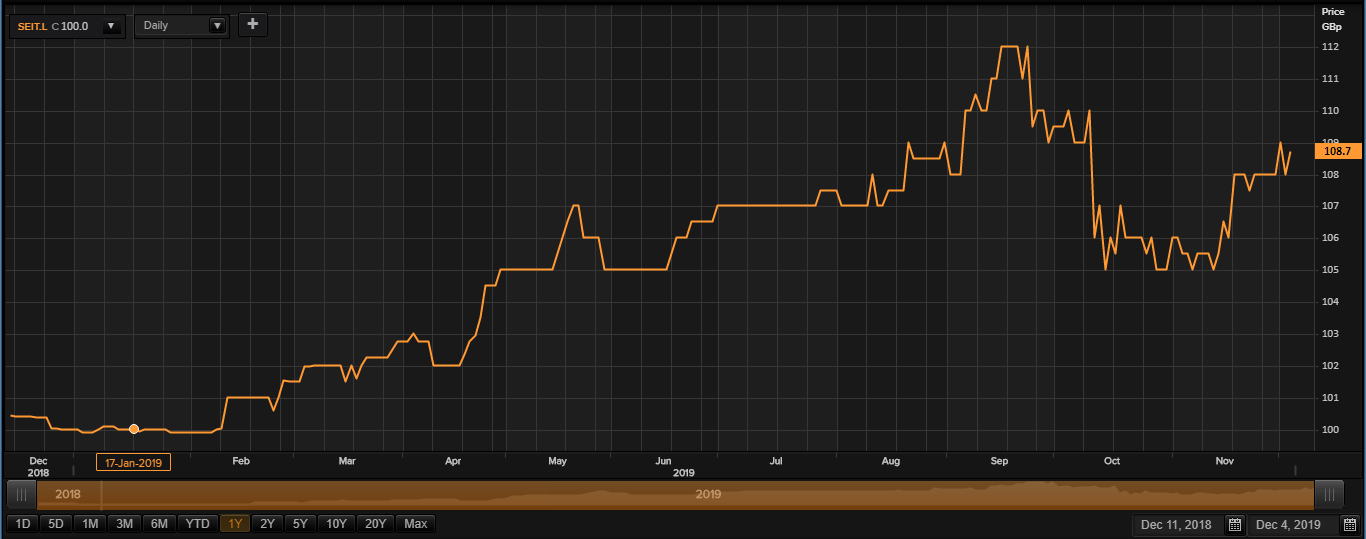
(Source: Thomson Reuters) Daily Chart as on 04th-December-19, prior to the close of the market
On 4th December 2019, at 10:32 A.M GMT, while writing, SDCL Energy Efficiency Income Plcâs share price was reported to be trading on the London Stock Exchange at GBX 108.70 per share, an increase of 0.64 per cent or GBX 0.70 per share, as compared to the previous dayâs closing price, which was reported to be at GBX 108.00 per share. At the time of reporting, the SDCL Energy Efficiency Income Plcâs share was reported to be trading 10.91 per cent above the 52-week low share price, which was at GBX 98.00 per share, that the companyâs shares reached on December 18, 2018. The companyâs total market capitalisation (M-Cap) was reportedly valued to be at GBP 288.59 million with respect to the shareâs current market price.
The SDCL Energy Efficiency Income Plcâs share has given a positive return in the last one month in the value, of around 1.89 per cent. SDCL Energy Efficiency Income Plcâs share generated a return of 8 per cent in value, in the Year to Date time frame.
The beta (180 D) of the SDCL Energy Efficiency Income Plcâs share has been reported to be at 0.01. This basically implies that the volatility in the price of the companyâs stock is less than the volatility in the movement of the comparative benchmark index.
