


GVC Holdings PLC
Isle of Man-incorporated sports-betting and gaming group, GVC Holdings PLC (Identifier: GVC) owns some of the leading brands in the gaming industry and is one of the largest sports-betting and gaming groups in the world. The companyâs operations are differentiated in five operating segments, namely Online, UK Retail, European Retail, Other and Corporate.
GVC-Q3 Trading update for three-month period ended 30th September 2019
The company upgraded its (pre-IFRS 16) EBITDA guidance to £670 million - £680 million for FY19 from £650 million - £670 million. In the United States, the company had an encouraging start with the launch of mobile app called BetMGM in New Jersey. The company managed to refinance its debt amounting to â¬1,125 million successfully. The company launched GVC Global Foundation which will take care of the companyâs CSR activities around the globe.
GVC-Financial highlights for H1 FY19
In H1 FY19, the companyâs reported net gaming revenue surged by 61 per cent to £1,810.6 million as compared with the corresponding period of the last year. Reported revenue surged by 61 per cent to £1,782.1 million against the £1,105.9 million in H1 FY18. Underlying EBITDAR on a reported basis rose by 42 per cent to £376.8 million against the corresponding period in 2018. Underlying EBITDA on a reported basis increased by 56 per cent to £366.8 million as compared to £235 million in H1 FY18.
On a reported basis, the companyâs underlying profit before tax stood at £212.1 million and after charging £224.4 million (pre-tax) of separately disclosed items, reported group profit after tax stood at £2.1 million.
Diluted loss per share on a reported basis was 0.6 pence. Continuing adjusted diluted EPS on a reported basis declined by 2.8 per cent to 31.3 pence. The company proposed to pay an interim dividend per share of 17.6 pence, an increase of 10 per cent against the corresponding period in 2018.
On Proforma basis, NGR increased by 5 per cent and revenue surged by 5 per cent over the corresponding prior year period, due to the robust performance in Online and European Retail.
During the H1 FY19, and into 2020, the migration of the Ladbrokes Coral United Kingdom digital businesses onto the company technology platform will further increase âbest-of-bothâ best-practice for the company. The companyâs performance of the online division remains very robust due to an operating model that is supported by cutting-edge marketing techniques, and leading proprietary technology. In the longer term, the business is well-placed to deliver double-digit net gaming revenue growth. The closure of 900 shops would be a challenge for the business. The company applies central marketing expertise alongside local operational execution and leverages its proprietary technology and product development capability, which is highly flexible and enables it to release new features and products quickly and make rapid changes to the customer experience. This model is proving highly effective at minimal incremental cost, the company has the capacity to manage significant increases in volume. The opportunities provided by the integration and migration of Ladbrokes Coral and the joint venture in the US with MGM Resorts onto the GVC technology will bring these benefits to the broader group by helping to execute the operational delivery and grow the business. The company has put up sufficient security arrangements and systems to be prepared for potential risks. Moreover, the company is well positioned to capture the growth in the betting industry, and the board is confident of delivering strong EBITDA growth in future years.
GVC-Share price performance
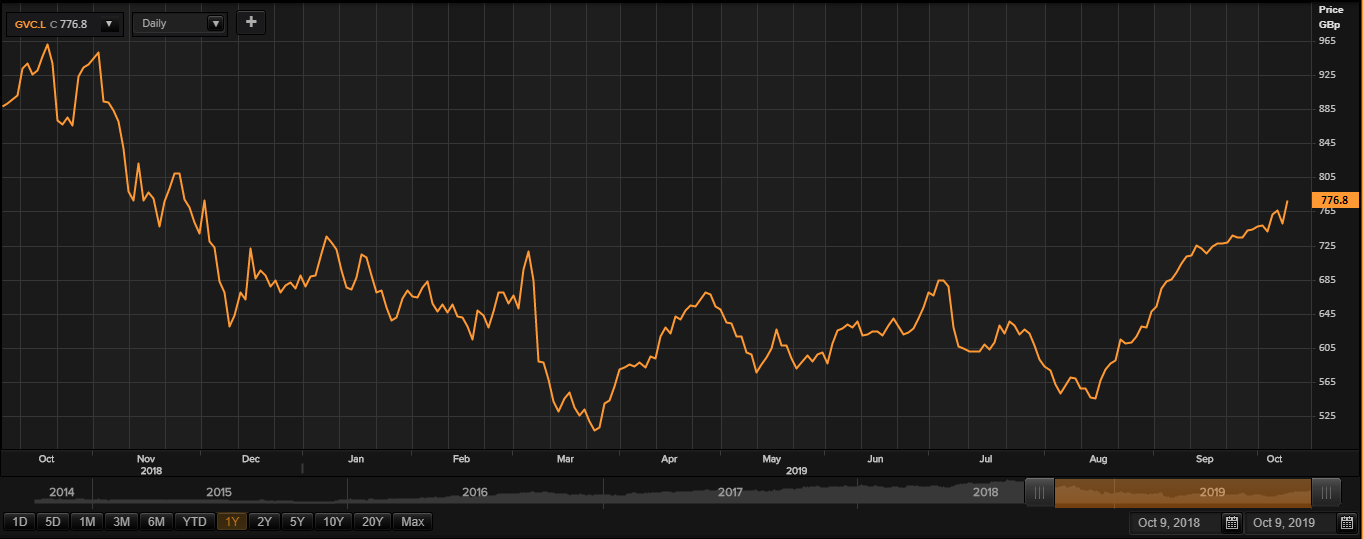
At the time of writing (at 12:38 PM GMT, as on 09 October 2019,) GVC Holdings PLC shares clocked a price level of GBX 776.8 per share. Market Capitalisation of the company stood at £4.36 billion at the time of writing.
GVC shares have touched a peak on 02 November 2018 at GBX 973.00 and a trough on 26 March 2019 at GBX 504.00 in the past year.
GVC shares have delivered a positive return of 9.62 per cent in the past one month. Also, From January to till date, the stock was up by approximately 11.28 per cent and was up by 19.24 per cent in the last quarter.
Â
Sector: Investment Trusts
TR European Growth Trust PLC
United Kingdom-based investment company, TR European Growth Trust PLC (Identifier: TRG) aims to achieve capital appreciation by investing in small and medium sized companies across Europe which operate in variety of sectors such as basic materials, consumer goods, natural resources, technology, industrial goods and financial services.
TRG-Financial highlights for FY19
The companyâs net assets were recorded at £521,023 thousand as on 30 June 2019 as against £574,591 thousand as on 30 June 2018. The companyâs NAV stood at 1,039.79 pence per share as on 30 June 2019 as against 1,146.70 pence per share as on 30 June 2018. The companyâs net revenue profit was recorded at £12,068 thousand in FY19 as against £11,025 thousand in FY18. The companyâs net capital loss stood at £54,863 thousand in FY19 as against £1,089 thousand in FY18.
The European market in the second half of the companyâs fiscal year 2019 continued its roller coaster ride amid Brexit uncertainty and trade tensions. Hence, the companyâs performance was not up to the mark, which resulted in a net asset value per share total return of -7.3% for the year ended 30 June 2019. However, the company has recommended a final dividend of 14.5 pence per share which has not been finalised yet and awaits approval from shareholders. This dividend pay-out is supposed to take place on 29 November 2019. The companyâs annual dividend stood at 22 pence per share in FY19 as against 19 pence per share in FY18.
TRG-Share price performance
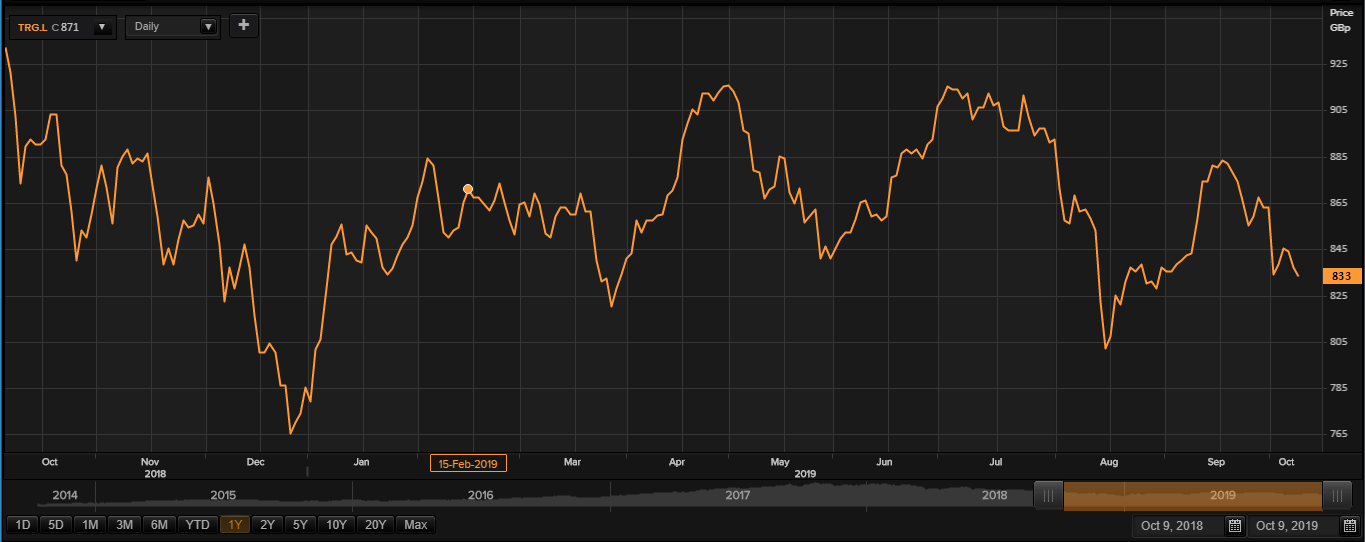
At the time of writing (at 12:41 PM GMT, as on 09 October 2019,) TR European Growth Trust PLC shares clocked a price level of GBX 833 per share. Market Capitalisation of the company stood at £419.41 million at the time of writing.
TRG shares have touched a peak on 09 October 2018 of GBX 934.19 and a trough on 27 December 2018 of GBX 760 in the past year.
TRG shares have delivered a negative return of 0.36 per cent in the past one month. Also, From January to till date, the stock was up by approximately 8.14 per cent and was down by 8.02 per cent in the last quarter.
Â
Sector: Construction and Materials
Â
Volution Group PLC
United Kingdom-based company, Volution Group Plc (Identifier: FAN) is a supplier of ventilation products in the construction of residential and commercial spaces. The company designs manufacture and supplies ventilation systems and related equipment.
FAN-Financial highlights for FY19
The companyâs revenue surged by 14.6 per cent to £235.7 million in FY19 as against £205.7 million in FY18. The companyâs operating profit (adjusted) surged by 13.3 per cent to £42.1 million in FY19 as against £37.1 million in FY18. The companyâs profit before taxation (adjusted) surged by 11.5 per cent to £39.9 million in FY19 as against £35.8 million in FY18. The companyâs earnings per share (adjusted) surged by 10.3 per cent to 16 pence in FY19 as against 14.5 pence in FY18.
The companyâs operating profit (reported) surged by 40.8 per cent to £24.7 million in FY19 as against £17.5 million in FY18. The companyâs profit before taxation (reported) surged by 38.3 per cent to £23.1 million in FY19 as against £16.7 million in FY18. The companyâs earnings per share (reported) surged by 37.3 per cent to 9.2 pence in FY19 as against 6.7 pence in FY18.
The companyâs net debt plunged by £2.6 million to £74.6 million in FY19 as against £77.2 million in FY18. The companyâs total dividend per share surged by 10.4 per cent to 4.9 pence in FY19 as against 4.44 pence in FY18.
FAN-Share price performance
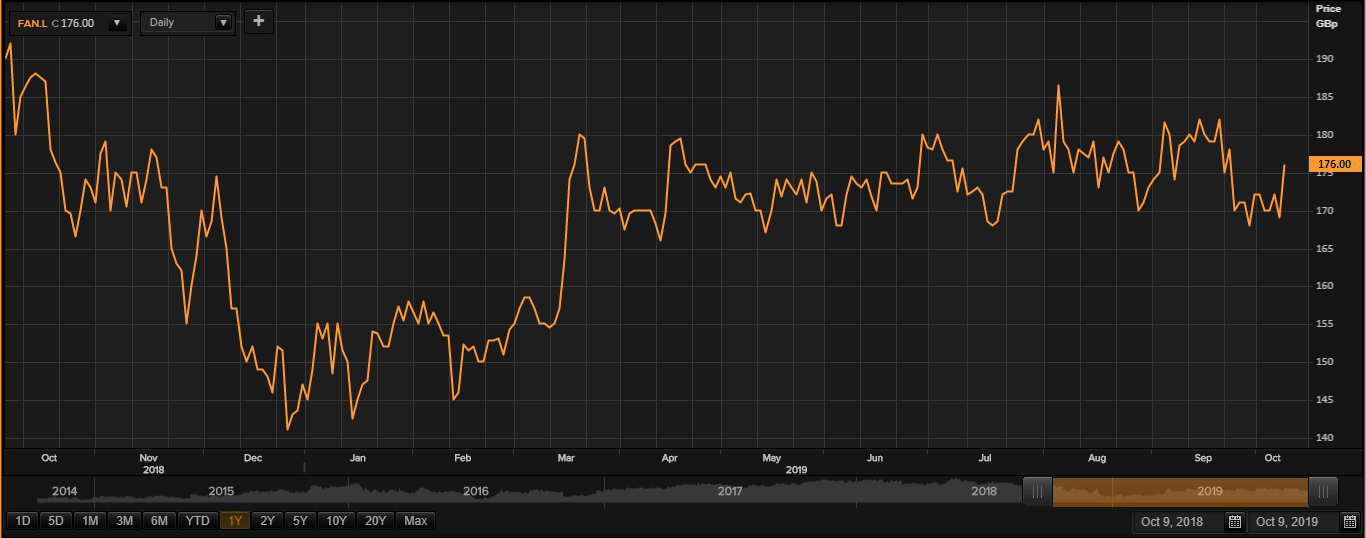
At the time of writing (at 12:44 PM GMT, as on 09 October 2019,) Volution Group Plc shares clocked a price level of GBX 176 per share. Market Capitalisation of the company stood at £335 million at the time of writing.
FAN shares have touched a peak on 10 October 2018 of GBX 194.70 and a trough on 02 January 2019 of GBX 140 in the past year.
FAN shares have delivered a negative return of 6.11 per cent in the past one month. Also, From January to till date, the stock was up by approximately 17.77 per cent and was down by 4.25 per cent in the last quarter.
