


Highlights
-
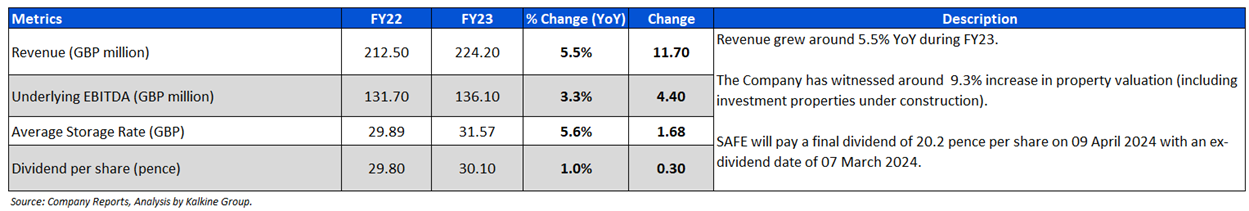
SAFE witnessed a notable growth in FY23 with a 5.5% increase in revenue and a 3.3% rise in underlying EBITDA.
-
The company claims to have sufficient liquidity, with around 73% of the debt held under fixed interest rates.
-
The company’s current ratio increased from 0.30x in FY22 to 0.45x in FY23.
Safestore Holdings PLC (LSE:SAFE) is one of UK’s largest and Europe’s second largest provider of self-storage. The company has its stores spread across the UK, the Paris region, Netherlands, Belgium, and Spain. It is an FTSE 250 index listed company with a market capitalization of GBP 1617.77 million. Its annual dividend yield stands at 4.06%.
FY23 financial highlights
In FY23, the company’s revenue grew by 5.5% versus FY22. Its underlying EBITDA grew by 3.3%. The current ratio also increased from 0.30x in FY22 to 0.45x during FY23. Similarly, the average storage rate (GBP) and dividend per share (pence) increased by 5.6% and 1.0% respectively.
Top 10 shareholders
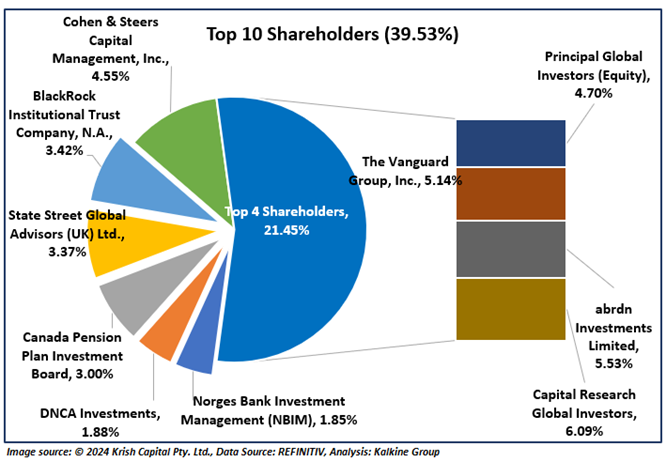
The top 10 shareholders of this company collectively hold ~39.53% stake in the company. Capital Research Global Investors holds the maximum number of shares (~6.09%). It is followed by Abrdn Investments Limited with ~5.53% shareholding, as illustrated in the chart below:
Company outlook
The company possesses sufficient liquidity with £200 million available under the RCF, along with an additional £100 million available through the accordion facility. Around 73% of its debt is held under fixed interest rates with maturity dates spanning from 2024 to 2033. In essence, the company's objective is to generate returns well ahead its capital costs.
Stock performance
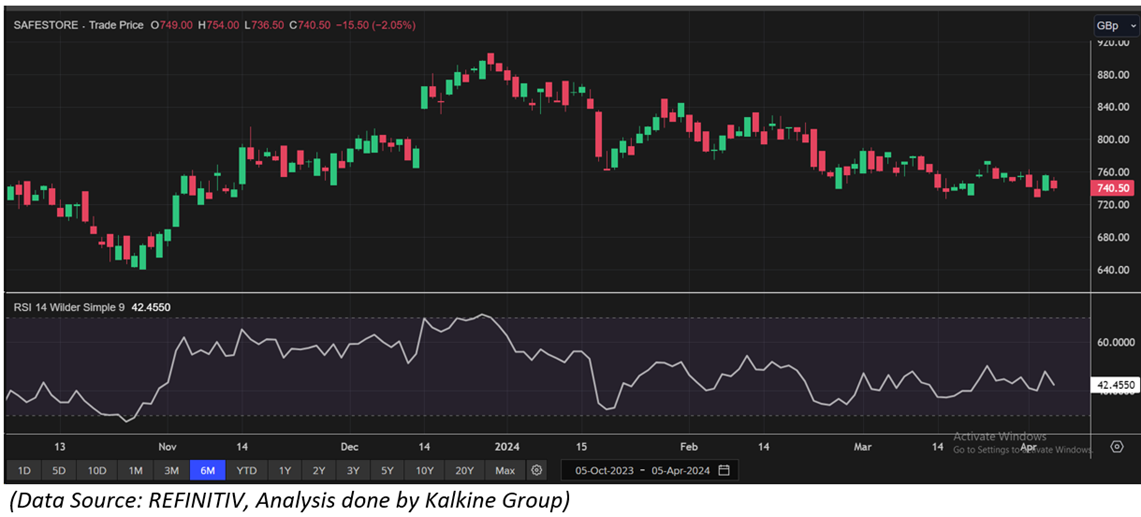
Over the past month, share price of SAFE has increased by about 4.08%, while over the last six months, it has seen a decline of around 2.99%. Its 52-week range spans from a low of GBX 641.00 to a high of GBX 1,029.00, with its current trading price below the average of this range.
Note 1: Past performance is not a reliable indicator of future performance.
Note 2: The reference data for all price data, currency, technical indicators, support, and resistance levels is 05 April 2024. The reference data in this report has been partly sourced from EODHD/Others.
