


Highlights
- NatWest Group PLC (LSE:NWG) is an FTSE 100 Index listed financial services company with operations in personal banking and commercial banking.
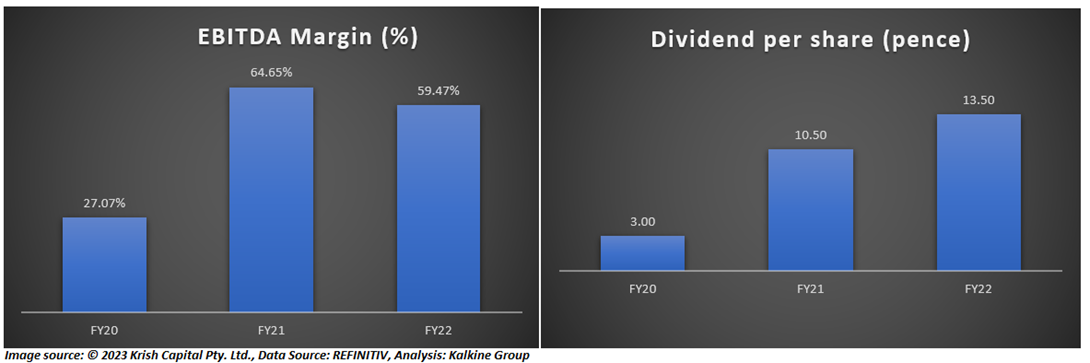
- For the year FY22, NatWest increased final dividend per share by approximately 33.3%.
- The group has achieved an attributable profit of £1,279 million and a return on tangible equity of 19.8% during Q1 FY23.
NatWest Group PLC (LSE:NWG) is an FTSE 100 Index listed financial services company with operations in personal banking and commercial banking.
For the year FY22, NatWest was able to increase the final dividend per share by approximately 33.3%. NWG's Bank NIM ascended 55 basis points year-on-year (YoY) to 2.85% during the year. In FY22, there was an increase of £7.3 billion in net lending to £366.3 billion, marking a growth of £14.4 billion in its retail banking mortgages.
An insight into Q1 FY23 numbers
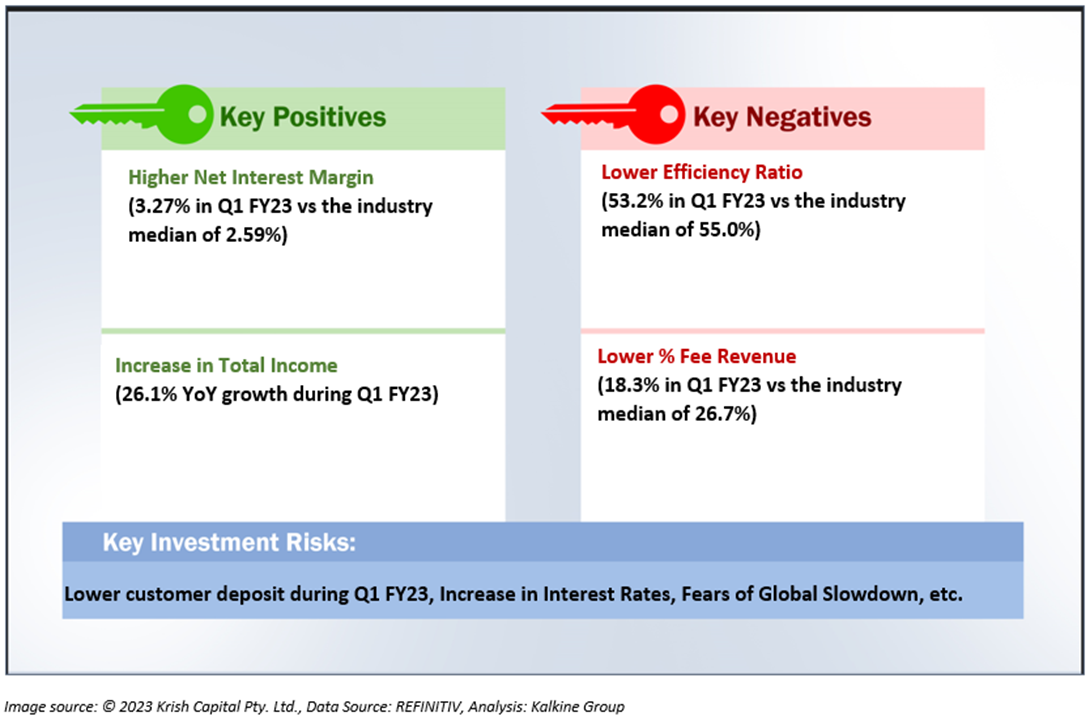
NWG wrapped up the first quarter of the fiscal year 2023 (Q1 FY23) with an improved performance. Its bank net interest margin increased by 7 basis points quarter-on-quarter (QoQ) and Common Equity Tier (CET1) ratio rose by 20 basis points QoQ during the quarter.
For the ongoing FY23, the firm is anticipating a return on tangible equity of 14-16%. Also, it is aiming its Group cost to income ratio to be less than 52% or around £7.6 billion of group operating costs for the year.
Notably, the group has achieved an attributable profit of £1,279 million and a return on tangible equity of 19.8% during Q1 FY23.
Goals marked for future
The NWG group is aiming to secure sustainable return on tangible equity of 14-16% over the medium term. By FY25, the firm is planning to deliver a cost to income ratio of lower than 50%.
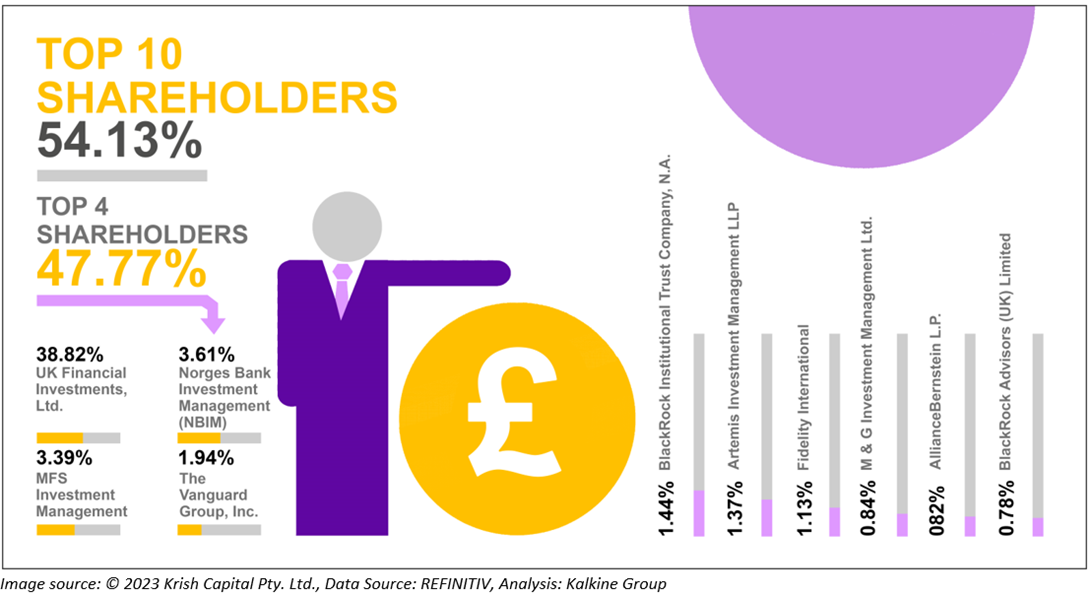
Top 10 Shareholders
The top 10 shareholders collectively form ~54.13% of the total shareholdings. UK Financial Investments, Ltd. holds the maximum number of shares with ~38.82% shareholding, followed by Norges Bank Investment Management (NBIM) with ~3.61% shareholding, as depicted in the chart below.
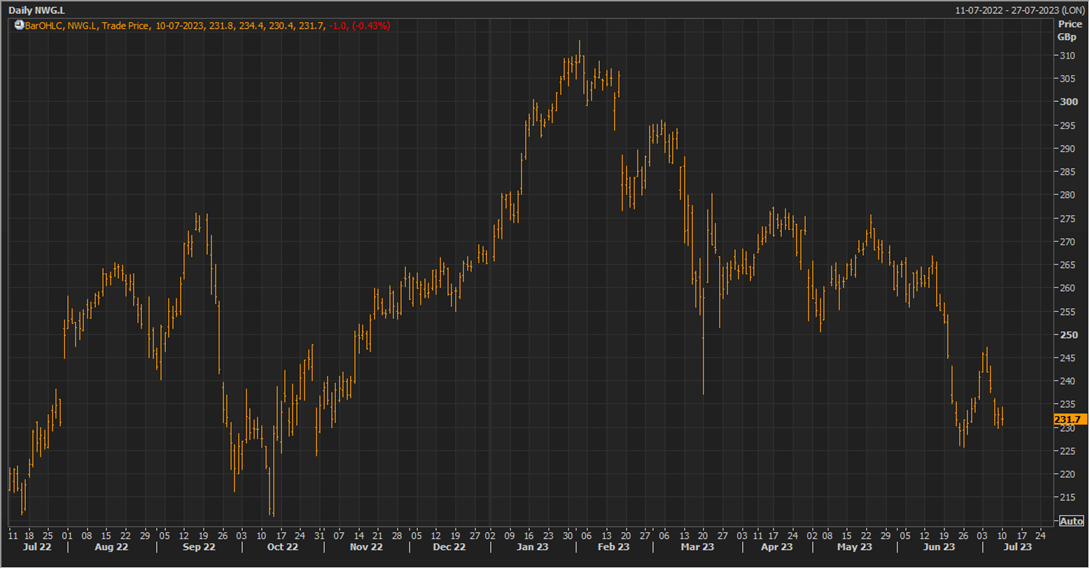
Stock Price Performance
The stock has witnessed a decline of ~11.22% in the last one month and over the last 6 months, it has decreased by ~16.59%. The stock has a 52-week low and 52-week high of GBX 210.90 & GBX 313.10, respectively and is currently trading below the average of 52-week high-low.
Data Source: EODHD/Others, Analysis done by Kalkine Group
Please note markets are trading in a highly volatile zone currently due to certain macro-economic and geopolitical tensions prevailing. Therefore, it is prudent to follow a cautious approach while investing.
Note 1: Past performance is not a reliable indicator of future performance.
Note 2: The reference data for all price data, currency, technical indicators, support, and resistance levels is 09 July 2023. The reference data in this report has been partly sourced from EODHD/Others.
