


Highlights
- Alliance Pharma PLC (LSE:APH) is a United Kingdom-based specialty pharmaceutical company.
- During H1 FY23, Alliance Pharma clocked a 7.42% year-on-year drop in its net debt.
- For the full fiscal year 2022, the company registered nearly 5% year-on-year jump in final dividend per share.
FTSE AIM UK 50 index-listed Alliance Pharma PLC (LSE:APH) is a United Kingdom-based specialty pharmaceutical company engaged in the acquisition, marketing, and distribution of pharmaceutical products. Also, the firm operates across several therapeutic areas of the cardiovascular, central nervous system, child health, consumer health, dermatology, endocrinology, gastroenterology, obstetrics, gynaecology, etc.
 During the first half of the year 2023, Alliance Pharma clocked a 7.42% year-on-year drop in its net debt. Its free cash flow increased by approximately 100% to £10.8 million during H1 FY23 from £5.1 million during H1 FY22.
For the full fiscal year 2022, the company registered nearly 5% year-on-year jump in final dividend per share. APH paid a final dividend of 1.184 pence per share in July this year, with an ex-dividend date of 22 June 2023. Its revenue was recorded at GBP 172 million during the reporting period, 1.4% up as compared to GBP 169 million in FY21.
Top 10 shareholders
Approximately 65.33% of the total shareholdings of the company are held by its top ten shareholders. While DBAY Advisors, Ltd. holds the maximum number of shares with around 21.10% shareholding, Slater Investments Ltd. owns nearly 9.6% shares in the firm.

Stock Price Performance
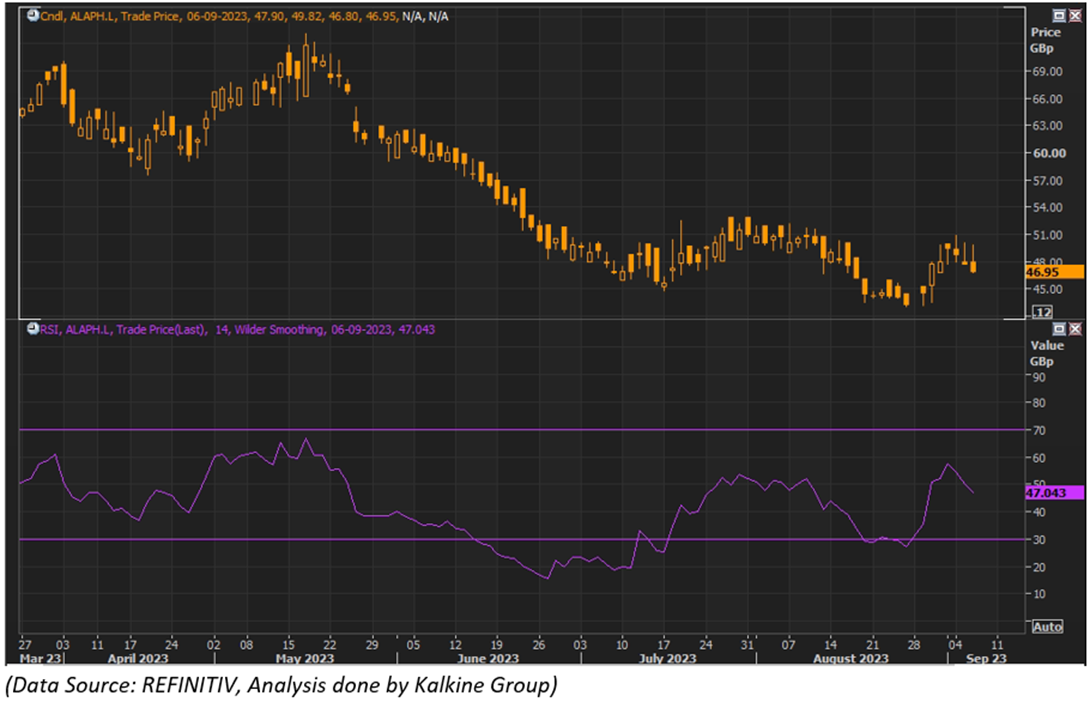
APH share price has dropped by over 6.7% in the last 30 days. It has declined by approximately 33.64% over the last six months. The stock’s 52-week low and 52-week high price stands at GBX 34.14 and GBX 81.80, respectively.
 Please note markets are trading in a highly volatile zone currently due to certain macro-economic and geopolitical tensions prevailing. Therefore, it is prudent to follow a cautious approach while investing.
Note 1: Past performance is not a reliable indicator of future performance.
Note 2: The reference data for all price data, currency, technical indicators, support, and resistance levels is 06 September 2023. The reference data in this report has been partly sourced from EODHD/Others.
