


Highlights
- Energean PLC (LSE:ENOG) is a hydrocarbon exploration and production company with prime focus on building a strong portfolio in the Mediterranean.
- The group reported an increase of 161% in total production to 94.4 kboed in Q1 FY23 versus 36.1 kboed in Q1 FY22.
- There was an increase of 69% in the total revenue of the company to US$288.8 million in Q1 FY23 as compared to US$170.7 million in pcp.
FTSE 250 listed Energean PLC (LSE:ENOG) is a hydrocarbon exploration and production company with prime focus on building a strong portfolio in the Mediterranean. The business objective of the firm involves exploration and investments in novel approach, finding solutions to generate and develop energy with a low carbon footprint.
The group reported an increase of 161% in the total production to 94.4 kboed (kilo barrel of oil equivalent per day) in the first quarter of the fiscal year 2023 (Q1 FY23) versus 36.1 kboed in Q1 FY22. Further, the gas production for the first four months ended on 30 April 2023, surged by 83% compared to previous corresponding period.
Also, there was an increase of 69% in the total revenue of the company to US$288.8 million in Q1 FY23 as compared to US$170.7 million in pcp. The EBITDAX for the reported period Q1 FY23 rose by 81% to US$162.2 million versus US$89.6 million in pcp.
The management declared that it will pay a dividend of US$0.30 per share for the reported period on 30 June 2023. This brings the annual dividend yield of ENOG to ~8.90% from the closing market of 13 June 2023.

FY23 Outlook
The company revised its full-year production guidance for FY23 to 125 – 140 kboed, compared to its previous guidance of 131 – 158 kboed. The management expects to deliver revenue of USD 2.5 billion, and the EBITDAX is estimated at USD 1.75 billion for FY23.
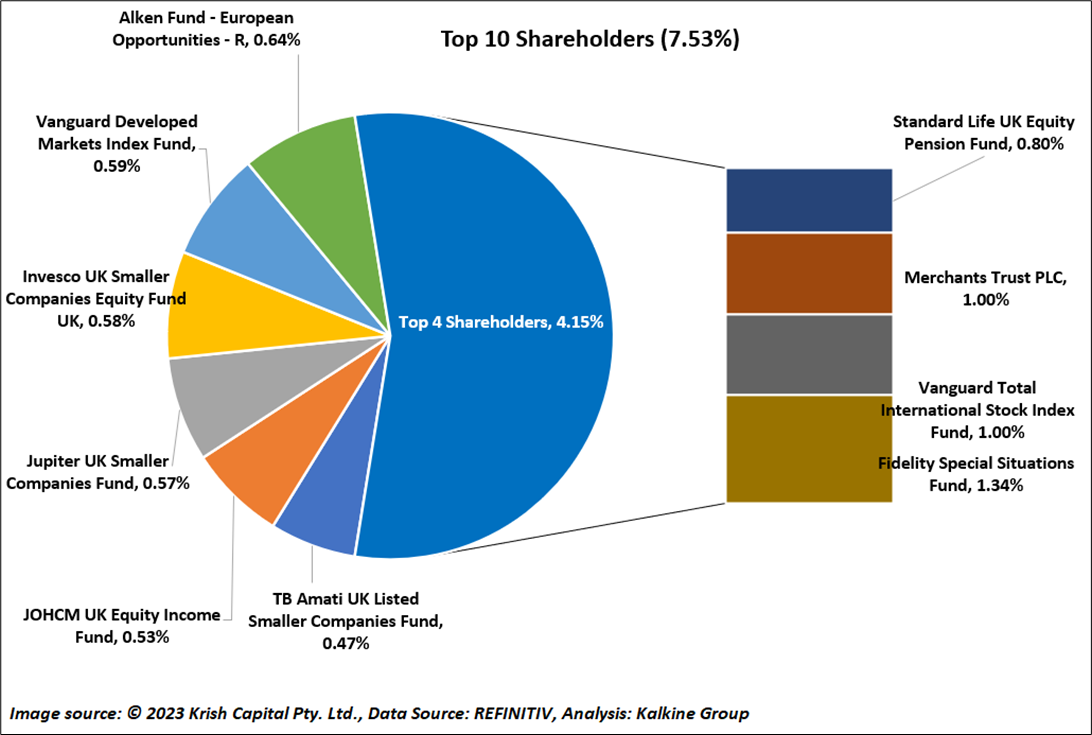
Top 10 Shareholders
The top 10 shareholders collectively form ~7.53% of the total shareholdings. Fidelity Special Situations Fund holds the maximum number of shares with ~1.34% shareholding, followed by Vanguard Total International Stock Index Fund with ~1.0% shareholding, as depicted in the chart below.
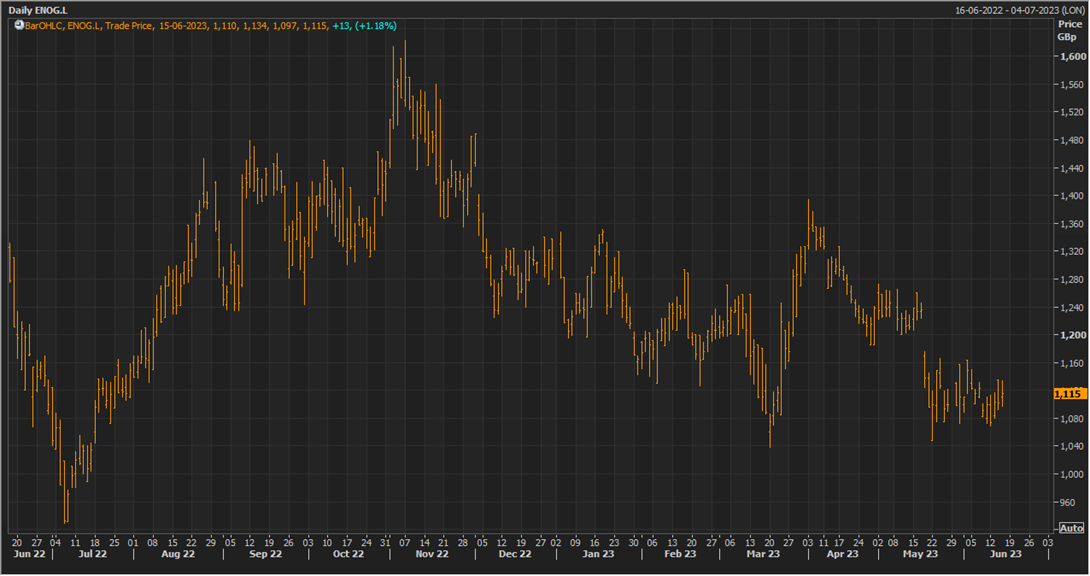
Stock Price Performance
The stock has witnessed a fall of ~9.5% in the last one month and over the last six months, it has fallen by ~13.2%. The stock has a 52-week low and 52-week high of GBX 929.50 & GBX 1,622.00, respectively.
Data Source: EODHD/Others, Analysis done by Kalkine Group
Please note markets are trading in a highly volatile zone currently due to certain macro-economic and geopolitical tensions prevailing. Therefore, it is prudent to follow a cautious approach while investing.
Note 1: Past performance is not a reliable indicator of future performance.
Note 2: The reference data for all price data, currency, technical indicators, support, and resistance levels is 16 June 2023. The reference data in this report has been partly sourced from EODHD/Others.
