AUS
AUS
 NZ
NZ
 UK
UK
 CA
CA
 USA
USA
 IND
IND





Storm Ciara
Storm Ciara is a thunderstorm that has hit the North-Western parts of Europe such as Netherlands, and in the morning of 9th February 2020, as British people woke up, it had started wreaking havoc in the United Kingdom as well. It was said that UK will have to face further pandemonium in the following forty-eight hours, with the challenge of Storm Ciara pounding the nation with winds of up to 100mph, resulting into flooding all across and major travel disruptions. Many flights were grounded, motorways and main roads shut down as well as trains were cancelled and postponed on account of railway tracks being closed in the wake of this thunderstorm that is expected to cause further interruption.
The British Meteorological Office has named the Storm âCiaraâ and published climate warnings and advisory notices for four days starting from Saturday till Tuesday. A yellow wind cautioning - the least dangerous of its three-warning system, was given for the entire country on Sunday, alongside a raised "amber" wind cautioning for a wide part of both England and Wales.
By the evening, on Sunday, in excess of 220 flood alerts stayed set up across England, generally in the north and south-west. No trains were running on the west coast mainline among Manchester and Scotland, and seriously diminished services were running on numerous different courses.
Impact on Economy and UK Businesses
Storm Ciara has caused a huge impact on the productivity of the country since its arrival. Companies have announced an off for their workforce on Monday, 10th February 2020 as per the directive of the Met Office in regards with the hazard, which has caused a loss in the output of the company.
The cotton industry of Manchester has suffered a lot, as one of the strongest storms was seen in the city of Manchester. Other than that, the aviation industry, as well as other travel and tourism companies, suffered a massive blow as travellers were issued a warning by the office to not travel during the period. Power and Utility sector have also been affected adversely by this calamity, as there were power cuts all across the country, primarily on the safety guidelines issued by the United Kingdom administration.
There have been flutter in the stock market as well with the arrival of storm Ciara; the following are the top and bottom performers of the FTSE 100 Index of the London Stock Exchange on 10th February 2020 by 1:00 P.M GMT.
Â
Top Performers
NMC Health Plc (LON:NMC) Share Price Performance
As on 10th February 2020, at 01:00 P.M (Greenwich Mean Time), by the time of writing this report, the NMC Health Plc share has been reported to be trading at a value of GBX 744.60 per share on the London Share Exchange Market, a surge in the price of   6.37 per cent or GBX 44.60 per share, as opposed to the price of the share on the previous trading day, which had been reported to be at GBX 700.00 per share. The market capitalisation (M-Cap) of the share stood at a value of GBP 1.460 billion, with respect to the current market price of the share of the company at the time of writing this report.
NMC Health Plc share had lost around 71.90 per cent in value, in the last twelve months, since February 11, 2019, when the stock was trading at a price of GBX 2650.00 per stock at the time of the close of the market. It has also been reported that the companyâs stock has lost approximately 63.19 per cent, in the last six months, in comparison with the stock price of GBX 2023.00 per share at the time of the close of the market as on August 09, 2019. NMC Health Plcâs stock has been reported to have lost 44.82 per cent, in last 30 daysâ time from the stock price of GBX 1349.50 per stock that the stock set as on January 10, 2020.
NMC Health Plcâs beta was reported to be at 0.61, indicating the fact that the share price movement of the NMC Health Plc share, is less volatile, as against the movement of the comparative benchmark index.
Barratt Developments Plc (LON:BDEV) Share Price Performance
As on 10th February 2020, at 01:05 P.M (Greenwich Mean Time), by the time of writing this report, the Barratt Developments Plc share has been reported to be trading at a value of GBX 821.00 per share on the London Share Exchange Market, a surge in the price of 2.70 per cent or GBX 21.60 per share, as opposed to the price of the share on the previous trading day, which had been reported to be at GBX 799.40 per share. The market capitalisation (M-Cap) of the share stood at a value of GBP 8.140 billion, with respect to the current market price of the share of the company at the time of writing this report.
Barratt Developments Plc share had gained around 42.98 per cent in value, in the last twelve months, since February 11, 2019, when the stock was trading at a price of GBX 574.20 per stock at the time of the close of the market. It has also been reported that the companyâs stock has gained approximately 28.89 per cent, in the last six months, in comparison with the stock price of GBX 637.00 per share at the time of the close of the market as on August 09, 2019. Barratt Developments Plcâs stock has been reported to have gained 8.57 per cent, in last 30 daysâ time from the stock price of GBX 756.20 per stock that the stock set as on January 10, 2020.
Barratt Developments Plcâs beta was reported to be at 0.74, indicating the fact that the share price movement of the Barratt Developments Plc share, is less volatile, as against the movement of the comparative benchmark index.
Bottom Performers
Hikma Pharmaceuticals Plc (LON:HIK) Share Price Performance
As on 10th February 2020, at 01:10 P.M (Greenwich Mean Time), by the time of writing this report, the Hikma Pharmaceuticals Plc share has been reported to be trading at a value of GBX 1846.00 per share on the London Share Exchange Market, a fall in the price of 3.45 per cent or GBX 66.00 per share, as opposed to the price of the share on the previous trading day, which had been reported to be at GBX 1912.00 per share. The market capitalisation (M-Cap) of the share stood at a value of GBP 4.633 billion, with respect to the current market price of the share of the company at the time of writing this report.
Hikma Pharmaceuticals Plc share had gained around 6.77 per cent in value, in the last twelve months, since February 11, 2019, when the stock was trading at a price of GBX 1729.00 per stock at the time of the close of the market. It has also been reported that the companyâs stock has lost approximately 5.50 per cent, in the last six months, in comparison with the stock price of GBX 1953.50 per share at the time of the close of the market as on August 09, 2019. Hikma Pharmaceuticals Plcâs stock has been reported to have lost 3.17 per cent, in last 30 daysâ time from the stock price of GBX 1906.50 per stock that the stock set as on January 10, 2020.
Hikma Pharmaceuticals Plcâs beta was reported to be at 0.84, indicating the fact that the share price movement of the Hikma Pharmaceuticals Plc share, is less volatile, as against the movement of the comparative benchmark index.
EasyJet Plc (LON:EZJ) Share Price Performance
As on 10th February 2020, at 01:20 P.M (Greenwich Mean Time), by the time of writing this report, the EasyJet Plc share has been reported to be trading at a value of GBX 1488.50 per share on the London Share Exchange market, a fall in the price of 1.46 per cent or GBX 22.00 per share, as opposed to the price of the share on the previous trading day, which had been reported to be at GBX 1510.50 per share. The market capitalisation (M-Cap) of the share stood at a value of GBP 5.999 billion, with respect to the current market price of the share of the company at the time of writing this report.
EasyJet Plc share had gained around 15.66 per cent in value, in the last twelve months, since February 11, 2019, when the stock was trading at a price of GBX 1287.00 per stock at the time of the close of the market. It has also been reported that the companyâs stock has gained approximately 50.66 per cent, in the last six months, in comparison with the stock price of GBX 988.00 per share at the time of the close of the market as on August 09, 2019. EasyJet Plcâs stock has been reported to have lost 0.70 per cent, in last 30 daysâ time from the stock price of GBX 1499.00 per stock that the stock set as on January 10, 2020.
EasyJet Plcâs beta was reported to be at 0.66, indicating the fact that the share price movement of the EasyJet Plc share, is less volatile, as against the movement of the comparative benchmark index.
Comparative Share Price Chart of NMC, BDEV, HIK and EZJ
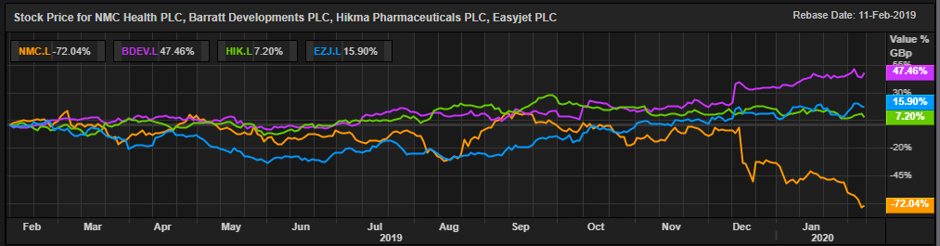
(Source: Thomson Reuters) Daily Chart as on 10-February-20, before the closing of the LSE Market