


Companies around the world set a record in dividends paid in the third quarter in the passing year, which stood at a value of US $355.3 billion, an increase of around 2.8 per cent from a year earlier. This performance continued for the whole year as listed companies across the world paid out approximately US $1.43 trillion worth of dividends during the financial year 2019. The new high of annual dividend pay-out from trading firms has been credited to the robust performances of these companies in stock exchanges in Northern American region, as well as in the emerging countries, which also included some unusually large amounts of special dividends paid during the period.
The chart below shows the average semi-annual dividend yields of all listed stocks in four major countries in the last 4 years.
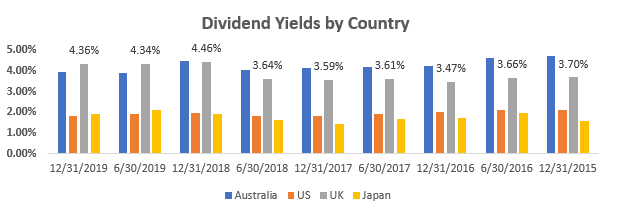
In terms of Average dividend yields in the last four years, Australia has been leading the way, but the United Kingdom comes in at a close second, and hence, despite the turbulent times of the economy, the investors have kept faith in the United Kingdom stocks, because of the ability of the companies to pay decent dividends, which act as an alternative of growth.

Below is the list of five key United Kingdom stocks, which are a part of the FTSE 100 index of the London Stock Exchange, that has dividend yields in the range of 5-6 per cent. The 5-6 per cent dividend yield range is a key factor here, as this generally suggests that these companies are paying out a decent dividend to investors as a part of the additional income, but also retaining enough earnings that can be reinvested in the company for further growth and to full fill the requirement of any additional capital.
Rio Tinto Plc (LON:RIO) Stock Price and Dividend Highlights
As on 24th February 2020, at 11:00 A.M (Greenwich Mean Time), by the time of writing this report, the Rio Tinto Plc stock was trading at a price of GBX 3994.00 per stock on the London Stock Exchange market, a decline in the value of 4.96 per cent or GBX 208.50 per stock, as opposed to the price of the stock on the previous trading day, which had been reported to be at GBX 4202.50 per stock. The annual dividend of the company was reported to be GBX 232.78 per share, while the annual dividend yield stood at 6.00 per cent. The companyâs last ex-dividend date has been reported to be August 08, 2019 and the last dividend pay date has been reported to be September 19, 2019.
At the time of writing this report, the market capitalisation of Rio Tinto Plc has been reported to be at a value of GBP 52.798 billion, with respect to the current trading price of the companyâs share.
The beta of the stock of the company was reported at a value of 1.49 at the time of writing. This indicates the fact that the movement in the price of the stock, is more volatile, as opposed to the movement in the value of the comparative benchmark index.
SSE Plc (LON:SSE) Stock Price and Dividend Highlights
As on 24th February 2020, at 11:05 A.M (Greenwich Mean Time), by the time of writing this report, the SSE Plc Stock was trading at a price of GBX 1654.00 per stock on the London Stock Exchange market, a decline in the value of 1.90 per cent or GBX 32.00 per stock, as opposed to the price of the stock on the previous trading day, which had been reported to be at GBX 1686.00 per stock. The annual dividend of the company was reported to be GBX 92.20 per share, while the annual dividend yield stood at 5.50 per cent. The companyâs last ex-dividend date has been reported to be January 16, 2020 and the dividend pay date has been reported to be March 13, 2020.
At the time of writing this report, the market capitalisation of SSE Plc has been reported to be at a value of GBP 17.371 billion, with respect to the current trading price of the companyâs share.
The beta of the stock of the company was reported at a value of 0.69 at the time of writing. This indicates the fact that the movement in the price of the stock, is less volatile, as opposed to the movement in the value of the comparative benchmark index.
Legal and General Group Plc (LON:LGEN) Stock Price and Dividend Highlights
As on 24th February 2020, at 11:10 A.M (Greenwich Mean Time), by the time of writing this report, the Legal & General Group Plc stock was trading at a price of GBX 300.50 per stock on the London Stock Exchange market, a decline in the value of 4.27 per cent or GBX 13.40 per stock, as opposed to the price of the stock on the previous trading day, which had been reported to be at GBX 313.90 per stock. The annual dividend of the company was reported to be GBX 16.75 per share, while the annual dividend yield stood at 5.30 per cent. The companyâs last ex-dividend date has been reported to be August 15, 2019 and the last dividend pay date has been reported to be September 26, 2019.
At the time of writing this report, the market capitalisation of Legal & General Group Plc has been reported to be at a value of GBP 18.725 billion, with respect to the current trading price of the companyâs share.
The beta of the stock of the company was reported at a value of 1.04 at the time of writing. This indicates the fact that the movement in the price of the stock, is more volatile, as opposed to the movement in the value of the comparative benchmark index.
Comparative Share Price chart of RIO, SSE and LGEN
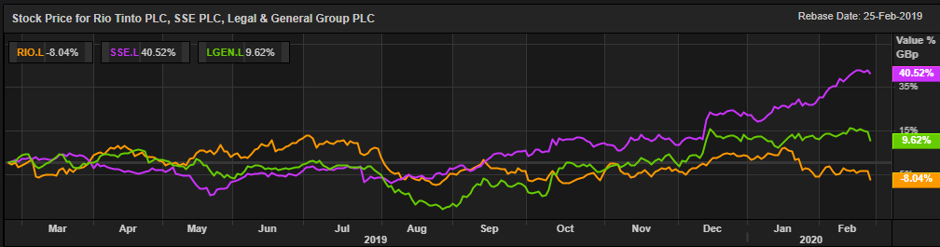
(Source: Thomson Reuters) Daily Chart as on 24-February-20, before the closing of the LSE Market
TUI AG (LON:TUIT) Stock Price and Dividend Highlights
As on 24th February 2020, at 11:15 A.M (Greenwich Mean Time), by the time of writing this report, the TUI AG stock was trading at a price of GBX 784.20 per stock on the London Stock Exchange market, a decline in the value of 7.85 per cent or GBX 66.80 per stock, as opposed to the price of the stock on the previous trading day, which had been reported to be at GBX 851.00 per stock. The annual dividend of the company was reported to be GBX 45.30 per share, while the annual dividend yield stood at 5.30 per cent. The companyâs last ex-dividend date has been reported to be February 12, 2020 and the last dividend pay date has been reported to be September 14, 2020.
At the time of writing this report, the market capitalisation of TUI AG has been reported to be at a value of GBP 5.012 billion, with respect to the current trading price of the companyâs share.
The beta of the stock of the company was reported at a value of 0.92 at the time of writing. This indicates the fact that the movement in the price of the stock, is less volatile, as opposed to the movement in the value of the comparative benchmark index.
J Sainsbury Plc (LON:SBRY) Stock Price and Dividend Highlights
As on 24th February 2020, at 11:20 A.M (Greenwich Mean Time), by the time of writing this report, the J Sainsbury Plc Stock was trading at a price of GBX 206.50 per stock on the London Stock Exchange market, a decline in the value of 1.95 per cent or GBX 4.10 per stock, as opposed to the price of the stock on the previous trading day, which had been reported to be at GBX 210.70 per stock. The annual dividend of the company was reported to be GBX 9.88 per share, while the annual dividend yield stood at 5.30 per cent. The companyâs last ex-dividend date has been reported to be November 14, 2019 and the last dividend pay date has been reported to be December 20, 2019.
At the time of writing this report, the market capitalisation of J Sainsbury Plc has been reported to be at a value of GBP 4.662 billion, with respect to the current trading price of the companyâs share.
The beta of the stock of the company was reported at a value of 1.12 at the time of writing. This indicates the fact that the movement in the price of the stock, is more volatile, as opposed to the movement in the value of the comparative benchmark index.
Comparative Share Price Chart of TUIT and SBRY
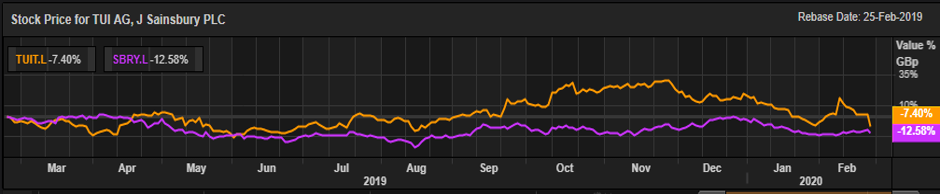
(Source: Thomson Reuters) Daily Chart as on 24-February-20, before the closing of the LSE Market
