


Business overview: Renishaw Plc
Renishaw Plc (LON:RSW) is among the worldâs leading engineering and technology company which specialises in healthcare and precision measurement. The company provides diversified products and services such as jet engines, surgical instruments and wind turbine etc. The company currently operates in 30 plus countries and possesses over 50 offices with an employee base of more than 3,000 people worldwide.
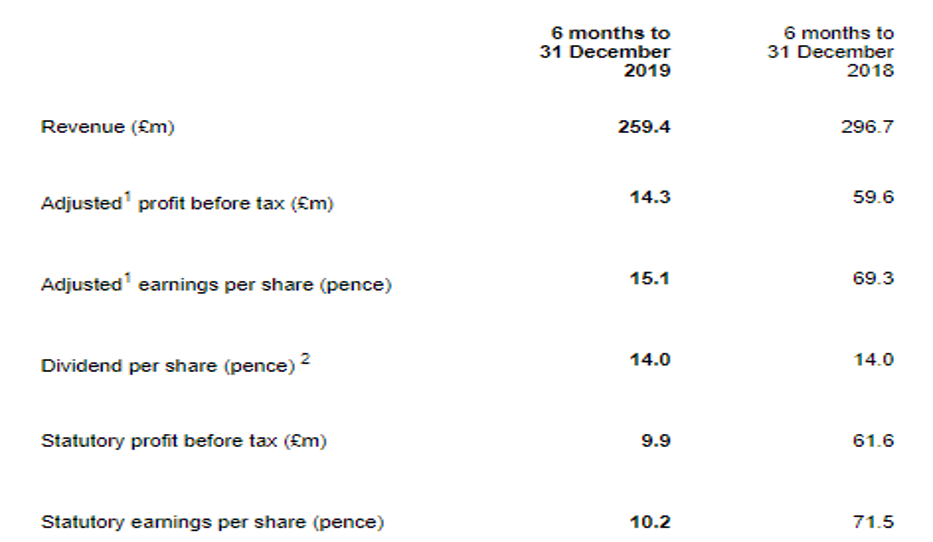
Renishaw Plc business highlights for H1 FY20
(Source: Companyâs filings, London Stock Exchange)
With all regions experiencing a reduction in revenue, the Groupâs Revenue for the six-month period ended 31 December 2019 was down by 14 per cent at the constant exchange rate (CER) to £259.4 million, in contrast to £296.7 million for the corresponding period last year. The revenue from APAC region was down by 20 per cent on a CER basis to £106.8 million in H1 FY20 as against £131.2 million in H1 FY19. The revenue from Americas region was down by 9 per cent on a CER basis to £63.6 million in H1 FY20 as against £65.4 million in H1 FY19. The revenue from EMEA region was down by 12 per cent on a CER basis to £89 million in H1 FY20 as against £100.1 million in H1 FY19.
The Group has been through some turbulence due to the ongoing uncertainty in the environment caused by the trade tensions between China and the US. The Company witnessed weaker demand in the machine tool sector and the global macroeconomic environment. However, in the APAC region, the group benefitted by procuring several large orders from the manufacturing companies operating in the consumer electronic sector.
Due to a reduction in revenue, the Groupâs adjusted profit before taxation was £14.3 million for the first half of the fiscal year 2020 in contrast to £59.6 million in the same period last year. In H1 FY19, the Group benefitted from a currency gain of £5.3 million as compared to a loss of £2.0 million in the first half of the fiscal year 2020. The Groupâs statutory profit before tax was £9.9 million for the first half of the fiscal year 2020 as compared to £61.6 million in the first half of the fiscal year 2019.
The Groupâs adjusted earnings per share were recorded at 15.1 pence during the period as against 69.3 pence in H1 FY19. The Group has declared an interim dividend of 14 pence per share during the period which remained flat as compared to the same period the previous year.
Renishaw Plc-Stock price performance
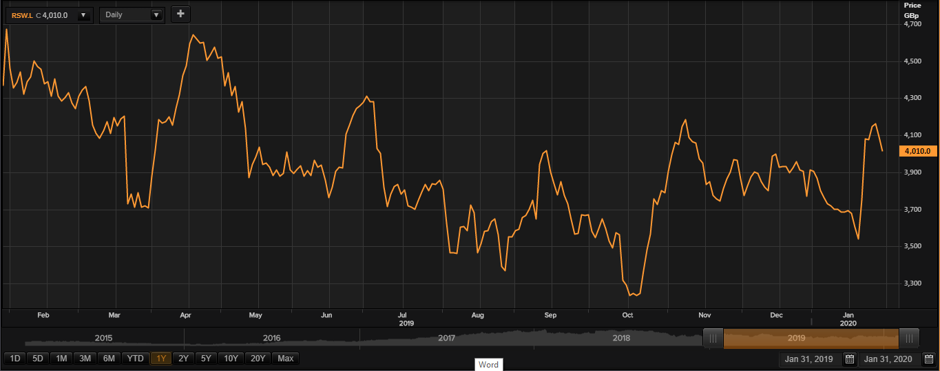
Daily Chart as at Jan-31-20, before the market close (Source: Thomson Reuters)
On 31st January 2020, at the time of writing (before market close, GMT 9:44 AM), Renishaw Plc shares were trading at GBX 4,010. Stock's 52 weeks High and Low is GBX 4,724.00 /GBX 3,030.00. Stockâs average traded volume for 5 days was 167,470.80; 30 days - 92,650.13 and 90 days - 96,727.74. The average traded volume for 5 days was up by 80.76% as compared to 30 days average traded volume. The companyâs stock beta was 0.99, reflecting similar volatility as compared to the benchmark index. The outstanding market capitalisation was around £2.96 billion.
Business overview: Staffline Group Plc
The United Kingdom domiciled Recruitment and Human resources company, Staffline Group Plc (LON:STAF) is headquartered in Nottingham and was incepted in the year 1986. The shares of the Group have their listing on the AIM segment of the London Stock Exchange under the ticker symbol STAF. The Group is a constituent of the FTSE AIM All share index. The Group is engaged in resource management and outsource recruits to the industry and services in the welfare to skills and work-related training. The Groupâs recruitment business operates from across 300 locations in Poland, Eire, and the United Kingdom. The Group operates in two segments: Staffing Services and PeoplePlus. Staffing services give workforce solutions to the manufacturing sectors. PeoplePlus includes the welfare of central & local government and commercial customers.
Staffline Group Plc FY 2019 Update
The Board has continued projects to improve Staffline's internal controls in the first half of the fiscal year 2020. The Group has undergone a rigorous internal review process along with a detailed review of the companyâs financials. According to the year-end audit, the company has already visualised to make further write-downs and increase certain provisions.
The board of the company now expects to report full year adjusted operating profit significantly below its previous guidance for the period ending 31st December 2019. The company has firm relationship with its lenders. The Group is taking strategic initiatives to reduce its debt during FY2020. The Board's expectations for the FY 2020 remains unchanged, and 2020 has started well for the company.
Staffline Group Plc -Stock price performance
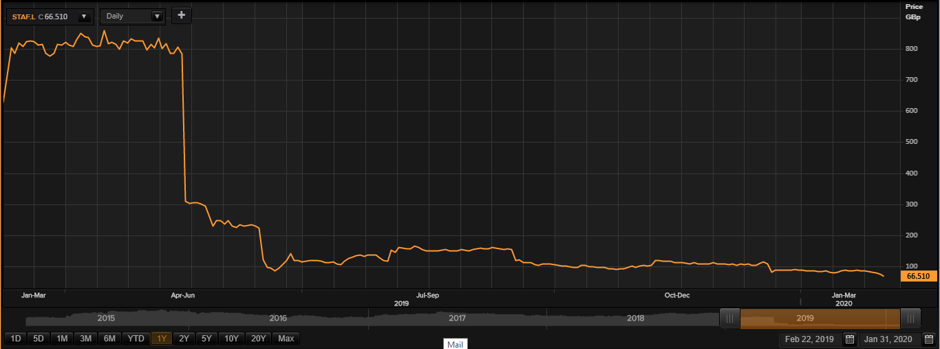
Daily Chart as at Jan-31-20, before the market close (Source: Thomson Reuters)
On 31st January 2020, at the time of writing (before market close, GMT 9:48 AM), Staffline Group Plc shares were trading at GBX 66.51. Stock's 52 weeks High and Low is GBX 1,026.67 /GBX 63.77. Stockâs average traded volume for 5 days was 113,859.60; 30 days - 216,038.77 and 90 days - 153,885.04. The average traded volume for 5 days was down by 47.30% as compared to 30 days average traded volume. The companyâs stock beta was 0.22, reflecting lower volatility as compared to the benchmark index. The outstanding market capitalisation was around £50.72 million.
Business overview: Unilever Plc
Unilever Plc (LON:ULVR), is a London based company engaged in the business of production and marketing of FMCG (fast-moving consumer goods) which includes wellbeing products, health products, home care products, beverages and food items. The company has operations across the Middle East, Africa, Asia-Pacific, Europe and the Americas, selling over 400 brands under its name. The company divided its operations into Refreshment, Others, Foods, Personal care and Home care segments. The companyâs brand portfolio includes Axe, Suave, Pure IT, SunSilk, Comfort, Surf Excel, Rexona, Dove, Lux, Wallâs, Lipton, Hellmannâs and Knorr. The distribution channels consist of direct consumer sales, out-of-home sales, e-commerce, small convenience stores, wholesalers, hypermarkets and supermarkets.
ULVR-Business performance for Full-year 2019
The Groupâs turnover surged by 2 per cent, which included a positive impact from currency-related items. The Groupâs underlying operating margin surged by 50 basis points to 19.1 per cent. The company generated free cash flow of â¬6.1 billion and improved its cash conversion during the period.
The companyâs underlying sales grew by 2.9 per cent with 1.6 per cent from price and 1.2 per cent from volume. The Home Care segment witnessed strong performances during the period. Despite a slow end in West Africa, South Asia and the Middle East, the Emerging markets grew by 5.3 per cent due to sound performance in Asia/AMET/RUB. The Groupâs Underlying earnings per share increased by 8.1 per cent to â¬2.55 during the period. The companyâs constant underlying earnings per share surged by 5.8 per cent during the period. The Groupâs diluted EPS was down by 38.4 per cent to â¬2.14.
The Groupâs return on invested capital surged to 19.2 per cent in FY19 in contrast to 18.1 per cent in the previous year due to higher underlying operating profit.
Unilever Plc -Stock price performance
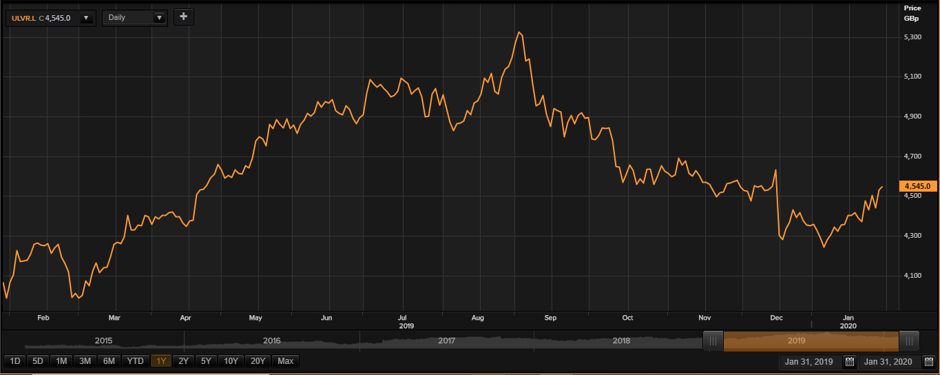
Daily Chart as at Jan-31-20, before the market close (Source: Thomson Reuters)
On 31st January 2020, at the time of writing (before market close, GMT 9:52 AM), Unilever Plc shares were trading at GBX 4,545. Stock's 52 weeks High and Low is GBX 5,333.00 /GBX 3,944.00. Stockâs average traded volume for 5 days was 2,796,450.60; 30 days - 2,179,631.53 and 90 days - 2,003,063.14. The average traded volume for 5 days was up by 28.30% as compared to 30 days average traded volume. The companyâs stock beta was 0.58, reflecting lower volatility as compared to the benchmark index. The outstanding market capitalisation was around £116.56 billion.
