


Summary
- Suncor Energy Inc will be operating the Syncrude Joint Venture next year, the company announced recently.
- Its stocks gained nearly 53 per cent month-to-date (MTD).
- Stocks of Cenovus Energy skyrocketed nearly 59 per cent MTD.
- Cenovus Energy created quite a buzz in October-end after it purchased rival oil and gas company Husky Energy in an all-stock deal.
After a drawn-out period of losses, stocks of Canadian oil and gas companies got a boost in November with the series of potential COVID-19 vaccines making headlines. Suncor Energy (TSX:SU) and Cenovus Energy Inc (TSX:CVE) stocks have been sailing near the top of Toronto Stock Exchange’s trending list.
The S&P/TSX Capped Energy index is currently down about 37 per cent year-to-date (YTD). But the index saw gains of 43.38 per cent this month and that of 41.12 per cent quarter-to-date.
Let’s take a look at the profiles of companies Suncor Energy and Cenovus Energy to under their recent performances better.
Suncor Energy Inc (TSX:SU)
Current Stock Price: C$ 22.99
Suncor Energy Inc will be operating the Syncrude Joint Venture next year, the company announced on Monday, November 23, after all its owners green-lit the decision. Suncor owns about 58 per cent of the project, along with Imperial Oil Resources Limited, Sinopec Oil Sands Partnership and CNOOC Oil Sands Canada.
Following this news, Suncor Energy CEO Mark Little said that the agreement will lead to some reduction of workforce in the company, said media reports. Back in October, the company had said that it would be downsizing its workforce by up to 15 per cent.
SUNCOR INC STOCK PERFORMANCE
Stocks of Suncor Energy posted a rebound from its pandemic-triggered lows this year after the news of potential COVID-19 vaccines broke in November. While the stocks of this Canadian oil and gas company continues to rally on the Toronto Stock Exchange (TSX), its 10-day average share movement volume stands at 11.9 million.
Suncor stocks register a loss of nearly 46 per cent this year and of nearly four per cent in the last six months.
In the last three months, however, the scrips climbed almost five per cent, while they gained nearly 53 per cent month-to-date.
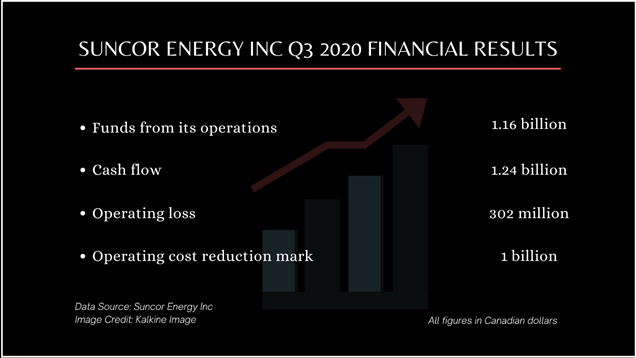
SUNCOR ENERGY INC Q3 2020 FINANCIAL RESULTS
Suncor Energy declared a quarterly dividend of C$ 0.21 and currently records a dividend yield of 3.654 per cent, as per the TMX Group data. The Calgary-based energy company generated funds worth C$ 1.16 billion from its operations in its third quarter of 2020, up from C$ 488 million in Q2 2020. However, its latest funds from operations were significantly down from C$ 2.6 billion in Q3 2019.
Suncor Energy had a cash flow of C$ 1.24 billion from its operating activities in the third quarter ending 30 September 2020, a drop from C$ 3.13 billion in Q3 2019.
Suncor Energy’s operating loss in the latest quarter stood at C$ 302 million. However, the amount was relatively lower from C$ 1.48 billion in Q2 2020.
Cenovus Energy Inc (TSX:CVE)
Current Stock Price: C$ 6.92
Cenovus Energy created quite a buzz in October-end when it purchased rival oil and gas company Husky Energy in an all-stock deal for C$ 3.8 billion. Soon after, the two companies released their third quarter results showing notable net losses.
Following the acquisition amid a year of pandemic, the company had come to the decision of downsizing its workforce by up to 25 per cent in October. Cenovus had said that most of the job cuts would take place in its Calgary wing, where its headquartered.
CVE STOCK PERFORMANCE
While Cenovus Energy stocks post a year-to-date loss of about 47 per cent, the scrips skyrocketed nearly 59 per cent in the month of November so far.
Following the March market crash, though, shares of Cenovus Energy also climbed 17 per cent in the last six months and almost seven per cent in the past three months.
The scrips registered an average share trading volume of 7.3 million in the last 10 days and that of 6.1 million in the last 50 days.
CVE THIRD QUARTER RESULTS
Cenovus Energy’s free funds flow stood at C$ 266 million in the third quarter of 2020. The amount helped cut down Cenovus’ net debt to C$ 7.5 billion at the end of the latest quarter ending 30 September 2020.
The Calgary-based energy company generated cash worth C$ 732 million from its operating activities in Q3 2020, a 12 per cent decrease from that of C$ 834 million in Q3 2019.
Cenovus incurred an operating loss of C$ 452 million in Q3 2020, as against an operating income of C$ 284 million. After quarterly net earnings of C$ 187 million in Q3 2019, the company also recorded a net loss of C$ 194 million in the third quarter of 2020.
