


Highlights
- Energy royalty company shows steady production and stable dividend stream
- Market momentum supported by strong long term shareholder performance trends
- Operational exposure tied closely to commodity cycles and drilling activity
The energy royalty sector in Canada includes companies that generate revenue through ownership of mineral rights rather than direct operational drilling.
Freehold Royalties (TSX FRU) operates within this space, offering exposure to upstream energy production without the burden of capital-intensive exploration. The company’s structure allows participation in production volumes across a diversified asset base, particularly across key North American basins. Within broader benchmarks such as s&p tsx composite index, royalty-focused entities contribute to the energy segment’s overall performance profile.
Sector structure overview
Energy royalty entities differ from traditional exploration firms by focusing on land ownership and revenue collection tied to production volumes. This model creates a distinct operational profile where cost exposure remains lower, while revenue fluctuates with commodity trends and production activity levels. Companies operating in this segment often maintain diversified portfolios spanning multiple basins, providing a degree of stability across cycles.
Within Canada, this structure has gained attention as it aligns with broader energy market dynamics. Participation in production without direct drilling responsibilities enables such firms to maintain lean operations. However, external factors such as commodity cycles and drilling intensity remain key drivers influencing performance patterns.
Production growth dynamics
Recent operational updates highlight increased production levels, reflecting stronger activity across key regions. Growth in barrels of oil equivalent per day has been supported by expanded exposure to United States assets, particularly within high-output regions such as the Permian Basin. This diversification enhances overall production resilience while balancing geographic exposure.
The integration of United States royalty assets has contributed to a richer mix of production streams. This shift plays a role in shaping overall operational output, providing broader exposure to varying commodity types and pricing environments. As drilling activity evolves, production volumes continue to reflect changes in regional development intensity.
Earnings performance details
The latest financial update presents a decline in net earnings compared with prior periods, despite higher production levels. This contrast highlights the impact of external market conditions on royalty-based revenue structures. Variations in commodity pricing can influence overall earnings, even when operational metrics show expansion.
Margins remain influenced by the interplay between production volumes and realized commodity values. While increased output contributes positively, fluctuations in pricing environments can offset these gains. This dynamic underscores the sensitivity of royalty structures to broader market conditions.
Dividend distribution stability
A consistent monthly dividend has been reaffirmed, reflecting the company’s ongoing commitment to shareholder distributions. This steady payout structure remains a central feature of the royalty model, providing regular income streams derived from production activity.
Dividend sustainability is closely tied to production volumes and commodity trends. As revenue streams fluctuate with market conditions, maintaining stable distributions requires careful alignment between operational performance and financial management. The reaffirmation of the monthly payout signals continuity within this framework.
Market performance trends
Recent share movement indicates modest short-term gains alongside strong longer-term momentum. Over extended periods, total shareholder performance reflects sustained upward movement, aligning with broader energy sector recovery trends. This trajectory highlights the influence of commodity cycles on valuation dynamics (TSX FRU).
Short-term fluctuations appear more muted, suggesting a period of consolidation following previous gains. Market sentiment continues to reflect a balance between operational strength and external market influences, including commodity pricing and drilling activity levels.
Valuation narrative insights
Market narratives indicate that current valuation levels remain slightly below certain estimated fair value benchmarks. This perspective is supported by expectations of resilient margins, long reserve life, and a growing share of United States-based production. These elements contribute to the overall valuation framework.
The emphasis on reserve longevity and production mix plays a central role in shaping valuation discussions. As asset portfolios evolve, the balance between Canadian and United States exposure influences long-term valuation considerations. This dynamic continues to shape how market participants interpret company positioning.
Commodity exposure factors
Royalty-based revenue structures are inherently linked to commodity price movements. Changes in oil and natural gas markets directly influence revenue streams, creating variability in financial outcomes. This exposure remains a defining characteristic of the energy royalty sector.
In addition to pricing, production activity across key basins also plays a critical role. Variations in drilling intensity, particularly in regions such as the Permian Basin, impact overall production volumes and, by extension, revenue generation. These factors combine to shape operational performance patterns.
Operational asset distribution
The company’s asset base spans multiple regions, with a growing emphasis on United States properties. This diversification enhances exposure to different production environments, contributing to overall stability. The inclusion of high-activity basins supports consistent production levels.
Canadian assets continue to provide a foundation within the portfolio, while United States exposure adds growth potential through higher activity levels. This balanced approach allows participation across varying market conditions, reflecting a diversified operational strategy.
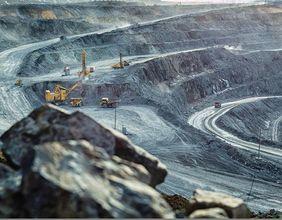
Permian basin activity
The Permian Basin remains a key contributor to production growth, driven by high drilling activity and strong output levels. Royalty (TSX FRU) interests within this region benefit from ongoing development, supporting overall production expansion.
Activity levels within the basin influence broader performance trends, as increased drilling leads to higher production volumes. This relationship highlights the importance of regional dynamics in shaping overall operational outcomes.
Revenue stream structure
Revenue generation within the royalty model is tied directly to production volumes and commodity values. This structure eliminates the need for direct capital expenditure on drilling, while maintaining exposure to output levels across multiple assets.
The diversification of revenue streams across regions and commodity types provides a degree of balance. However, fluctuations in market conditions continue to influence overall revenue patterns, reflecting the cyclical nature of the energy sector.
Shareholder distribution model
The distribution model emphasizes regular payouts derived from production-based revenue. This approach aligns with the broader royalty framework, where consistent cash flow supports ongoing distributions.
Maintaining this model requires alignment between operational performance and financial management. As production levels and commodity trends evolve, the distribution structure adapts to reflect changing revenue conditions.
Sector index comparison
Performance within the energy royalty segment can be viewed alongside broader indices such as the TSX Smallcap Index. These benchmarks provide context for understanding sector positioning within the overall market.
Energy-related components within these indices often reflect commodity-driven trends. Royalty companies contribute to this performance through their exposure to production activity and pricing dynamics, aligning with broader sector movements.
Long term momentum factors
Extended performance trends highlight sustained upward movement over longer periods. This momentum reflects a combination of operational growth, commodity market recovery, and consistent distribution policies.
The interplay between production expansion and market conditions continues to shape long-term performance patterns. As energy markets evolve, these factors remain central to understanding momentum within the royalty segment.
Financial performance variability
Variability in financial outcomes reflects the sensitivity of royalty structures to external conditions. While production growth contributes positively, fluctuations in commodity values can influence overall financial results.
This variability underscores the importance of diversified asset portfolios and exposure to multiple regions. By balancing production sources, the company mitigates the impact of localized changes in activity or pricing environments.
North American asset mix
The integration of North American assets enhances diversification, providing exposure to both Canadian and United States production environments. This mix supports balanced growth and operational resilience.
Differences in regulatory frameworks, drilling activity, and resource characteristics across regions contribute to a varied production profile. This diversity plays a role in shaping overall operational performance.
Energy market influences
Broader energy market trends continue to influence royalty-based companies. Changes in supply-demand dynamics, geopolitical developments, and technological advancements all contribute to shaping market conditions.
These influences affect both commodity values and production activity levels, which in turn impact revenue streams. Understanding these dynamics provides insight into the operational environment within which royalty companies operate.
Production efficiency trends
Efficiency within the royalty (TSX FRU) model stems from the absence of direct operational responsibilities. This structure allows companies to benefit from production without incurring the associated costs of drilling and development.
As operators within the asset base improve efficiency and increase output, royalty holders benefit from enhanced production volumes. This relationship highlights the indirect advantages of technological advancements within the sector.
Distribution sustainability factors
Sustaining regular distributions depends on consistent production levels and stable commodity environments. Variations in these factors can influence the ability to maintain payout levels over time.
Financial management plays a key role in balancing revenue fluctuations with distribution commitments. This balance remains central to the ongoing operation of the royalty model.
Market sentiment drivers
Market sentiment surrounding royalty companies reflects a combination of operational performance and external conditions. Positive production trends and stable distributions contribute to favourable sentiment, while commodity fluctuations introduce variability.
Short-term sentiment often aligns with immediate market conditions, whereas longer-term perspectives focus on structural advantages within the royalty model. These differing views shape overall market perception.
Asset longevity considerations
Reserve life and asset longevity remain key components within the royalty framework. Long-lived assets provide sustained production over extended periods, supporting consistent revenue generation.
The evaluation of reserve quality and longevity influences overall company positioning within the sector. This factor contributes to broader discussions surrounding valuation and operational sustainability.
Drilling activity impact
Changes in drilling activity directly affect production volumes within royalty portfolios. Increased activity leads to higher output, while reduced drilling can result in slower production growth.
Monitoring activity levels across key regions provides insight into expected production trends. This relationship highlights the importance of external operational factors in shaping royalty performance (TSX FRU).
