TSX Composite Falls 1.38%, Genworth MI & Husky Energy Top Gainers

2 min read | October 26, 2020 07:11 PM PDT | By Team Kalkine Media

The S&P/TSX Composite Index fell 1.38 percent to 16,079.55 on Monday, October 26. At the closing bell, the index traded below its crucial short-term support level of 50-day simple moving average (SMA) and below its immediate support levels of 5-day, 10-day, 20-day and 30-day SMAs. However, managed to trade above its long-term support level of 200-day SMA. The leading momentum indicator, Moving Average Convergence Divergence (MACD), is hovering below its 9-day SMA signal line, with the difference between 12-day and 26-day exponential moving average (EMA) being negative. The TSX Composite is down 5.8% year-to-date.

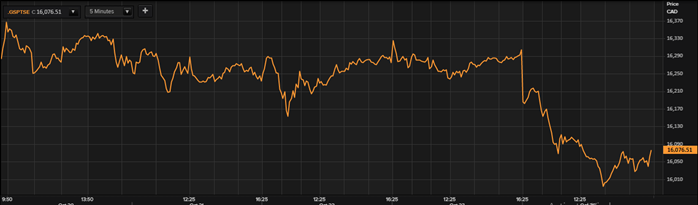
5-day Price Chart (as on October 26, 2020, after markets close); Source: EODHD/Others (Thomson Reuters)

At the last closing, the S&P/TSX Composite Index offering a dividend yield of 3.64% and traded at a Price-to-Earnings (PE) multiple of 17.43x.


Stocks in Play*


Gainers: Genworth MI Canada (up 24.2%), Husky Energy Inc (up 12%) and Alamos Gold Inc (up 3%)

Losers: Vermilion Energy Inc (down 9%), Enerplus Corp (down 5.6%) and Aurora Cannabis Inc (down 5.5%)

Volume Leaders: Enbridge Inc, Suncor Energy Inc, and Toronto-Dominion Bank.

On Wall Street: Bears were active after reported cases of coronavirus infection jumped and negotiations for a fiscal stimulus package before the election stalled once again. The Dow Jones Industrials dropped 650.19 points or 2.29% to 27,685.38, the Nasdaq Composite was down 189.34 points or 1.64% to 11,358.94 and the S&P 500 index traded down 64.42 points or 1.86% to 3,400.97. 

Commodity News*

Gold futures traded higher by 0.03% to US$ 1,905.7.

Brent Oil was up 3.14% to US$ 40.46 /bbl and WTI Crude Oil also down by 3.24% to US$38.56/bbl.


*Details after markets close October 26, 2020.


Disclaimer

The content, including but not limited to any articles, news, quotes, information, data, text, reports, ratings, opinions, images, photos, graphics, graphs, charts, animations and video (Content) is a service of Kalkine Media LLC (Kalkine Media, we or us) and is available for personal and non-commercial use only. The principal purpose of the Content is to educate and inform. The Content does not contain or imply any recommendation or opinion intended to influence your financial decisions and must not be relied upon by you as such. Some of the Content on this website may be sponsored/non-sponsored, as applicable, but is NOT a solicitation or recommendation to buy, sell or hold the stocks of the company(s) or engage in any investment activity under discussion. Kalkine Media is neither licensed nor qualified to provide investment advice through this platform. Users should make their own enquiries about any investments and Kalkine Media strongly suggests the users to seek advice from a financial adviser, stockbroker or other professional (including taxation and legal advice), as necessary. Kalkine Media hereby disclaims any and all the liabilities to any user for any direct, indirect, implied, punitive, special, incidental or other consequential damages arising from any use of the Content on this website, which is provided without warranties. The views expressed in the Content by the guests, if any, are their own and do not necessarily represent the views or opinions of Kalkine Media. Some of the images/music that may be used on this website are copyright to their respective owner(s). Kalkine Media does not claim ownership of any of the pictures/music displayed/used on this website unless stated otherwise. The images/music that may be used on this website are taken from various sources on the internet, including paid subscriptions or are believed to be in public domain. We have used reasonable efforts to accredit the source (public domain/CC0 status) to where it was found and indicated it, as necessary.


Sponsored Articles


Investing Ideas

Previous Next