


Highlights
- Qantas reported an 8.8% YoY revenue increase to AUD 23,823 million in FY25.
- Statutory profit after tax rose 28.3% YoY to AUD 1,605 million in FY25.
- Gross margin reached 52.7% in FY25, significantly above the industry median of 44.1%
Qantas Airways Limited (ASX:QAN) operates in the aviation sector, offering both domestic and international passenger flight services. The company also provides air freight transportation.
Financial Update
For the 12 months ended 30 June 2025 (FY25), the company has reported an 8.8% YoY increase in revenue and other income to AUD 23,823 million, compared with AUD 21,939 million in FY24. The growth was supported by passenger demand in both domestic and international segments, higher capacity, and improved load factors. Underlying EBITDA stood at AUD 4,638 million in FY25, up from AUD 4,052 million in the previous year. Statutory profit after tax increased by 28.3% YoY to AUD 1,605 million in FY25, up from AUD 1,251 million in FY24.
Business Update
On 3 October 2025, the company reported that 53,205 performance rights lapsed on 30 September 2025, as the necessary conditions for their conversion into securities were not satisfied.
Key Positives and Negatives
In FY25, the company achieved a gross margin of 52.7% compared to the industry median of 44.1%, and in the same year an asset turnover ratio of 1.08x, exceeding the industry median of 0.52x. However, the EBITDA margin of 19.3% was below the industry median of 20.6% in FY25, and the debt-to-equity ratio remained high at 10.23x in FY25 compared to Industry median of 2.87x.
Business Outlook
The group forecasts a rise in revenue per available seat kilometer (RASK) for the first half of FY26 relative to the same period in FY25. Depreciation and amortization are anticipated to be about AUD 2.3 billion, and net finance costs are expected to be close to AUD 0.3 billion.
Share Performance of QAN
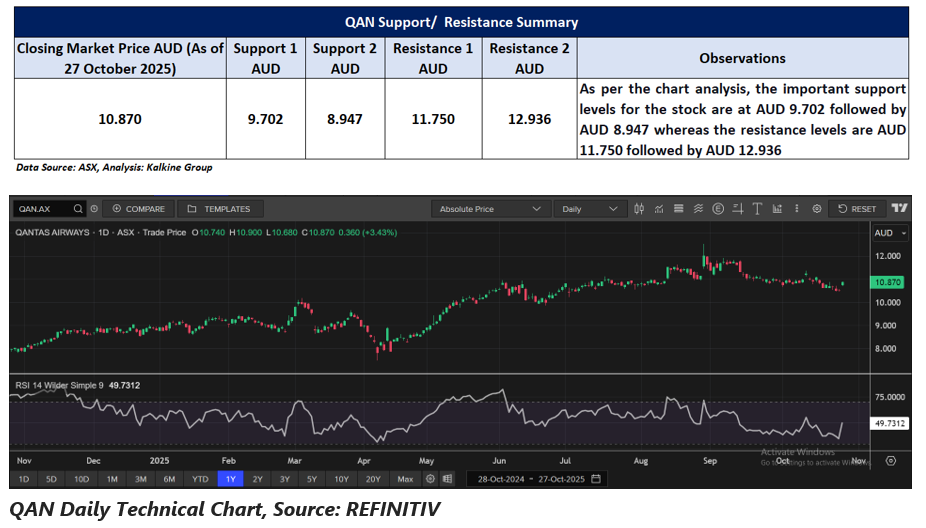
QAN’s shares were trading at AUD 10.870 per share on 27 October 2025 with intraday gain of 3.43%. QAN stock gained 1.16% over the past three months, 27.51% over the past six months, and 40.05% over the past year.
52-week high of QAN is AUD 12.509 and 52-week low is AUD 7.484.
Support and Resistance Summary
Note 1: Past performance is neither an Indicator nor a guarantee of future performance.
Note 2: The reference date for all price data, and currency, is 27 October 2025. The reference data in this report has been partly sourced from EODHD/Others.
Technical Indicators Defined:
Support: A level at which the stock prices tend to find support if they are falling, and a downtrend may take a pause backed by demand or buying interest. Support 1 refers to the nearby support level for the stock and if the price breaches the level, then Support 2 may act as the crucial support level for the stock.
Resistance: A level at which the stock prices tend to find resistance when they are rising, and an uptrend may take a pause due to profit booking or selling interest. Resistance 1 refers to the nearby resistance level for the stock and if the price surpasses the level, then Resistance 2 may act as the crucial resistance level for the stock.
Disclaimer
This article has been prepared by Kalkine Media, echoed on the website kalkinemedia.com/au and associated pages, based on the information obtained and collated from the subscription reports prepared by Kalkine Pty. Ltd. [ABN 34 154 808 312; AFSL no. 425376] on Kalkine.com.au (and associated pages). The principal purpose of the content is to provide factual information only for educational purposes. None of the content in this article, including any news, quotes, information, data, text, reports, ratings, opinions, images, photos, graphics, graphs, charts, animations, and video is or is intended to be, advisory in nature. The content does not contain or imply any recommendation or opinion intended to influence your financial decisions, including but not limited to, in respect of any particular security, transaction, or investment strategy, and must not be relied upon by you as such. The content is provided without any express or implied warranties of any kind. Kalkine Media, and its related bodies corporate, agents, and employees (Kalkine Group) cannot and do not warrant the accuracy, completeness, timeliness, merchantability, or fitness for a particular purpose of the content or the website, and to the extent permitted by law, Kalkine Group hereby disclaims any and all such express or implied warranties. Kalkine Group shall NOT be held liable for any investment or trading losses you may incur by using the information shared on our website.
