


Highlights
- In FY24, Kelsian Group reported a 42% YoY increase in revenue to AUD 2,016.8 million.
- Revenue growth was supported by All Abroad America! Holdings, Inc. contributions and new contracts in Sydney.
- Underlying EBITDA for FY25 is projected to be between AUD 283–295 million.
Kelsian Group Limited (ASX:KLS) is an integrated multi-modal transport provider and tourism operator. The company operates three segments – International Bus, Australian Bus and Marine and Tourism. In the financial year 2024 (FY24), its revenue grew 42% YoY to AUD 2,016.8 million and underlying EBITDA surged 63.9% YoY to AUD 265.4 million. The revenue growth was driven by the contribution from All Abroad America! Holdings, Inc (AAAHI) and new Sydney contracts. Underlying EBITDA growth was underpinned by revenue growth and 180 basis-points increase in EBITDA margin to 13.2%.
The period saw 32.3% YoY increase in underlying net profit after tax to AUD 92.6 million.
Outlook
In FY25, underlying EBITDA is expected to fall in the range of AUD 283 – 295 million, with a skew towards the second half. The second half skew demonstrates benefits of Marine and Tourism initiatives coming online, rail replacement contracts and the expected ramp up in AAAHI growth relating to industrial construction projects.
Moreover, the company is expected to benefit from surge in short-term visitor arrivals in September 2024, reaching 630,700, and an 8.7% YoY rise in short-term resident returns to 1,020,960, as suggested by the data published by the Australian Bureau of Statistics (ABS) on 12 November 2024.
Share performance of KLS
KLS slares closed 1.3% higher at AUD 3.85 apiece on 14 November 2024. In the last one year, KLS’ share price has dropped by 40.22% and in the three months, the share price has declined by 24.36%. 52-week high of KLS is AUD 7.20, recorded on 31 January 2024, and 52-week low is AUD 3.58, recorded on 26 August 2024.
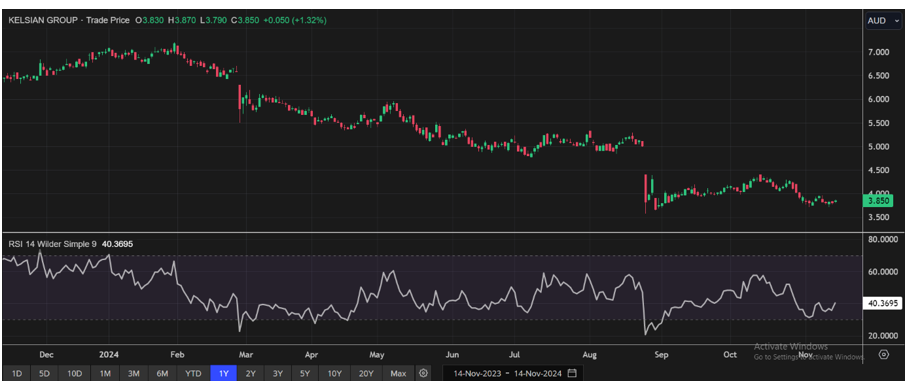
KLS Daily Technical Chart, Source: EODHD/Others
Note 1: Past performance is neither an Indicator nor a guarantee of future performance.
Note 2: The reference date for all price data, and currency, is 14 November 2024. The reference data in this report has been partly sourced from EODHD/Others.
Disclaimer
This article has been prepared by Kalkine Media, echoed on the website kalkinemedia.com/au and associated pages, based on the information obtained and collated from the subscription reports prepared by Kalkine Pty. Ltd. [ABN 34 154 808 312; AFSL no. 425376] on Kalkine.com.au (and associated pages). The principal purpose of the content is to provide factual information only for educational purposes. None of the content in this article, including any news, quotes, information, data, text, reports, ratings, opinions, images, photos, graphics, graphs, charts, animations, and video is or is intended to be, advisory in nature. The content does not contain or imply any recommendation or opinion intended to influence your financial decisions, including but not limited to, in respect of any particular security, transaction, or investment strategy, and must not be relied upon by you as such. The content is provided without any express or implied warranties of any kind. Kalkine Media, and its related bodies corporate, agents, and employees (Kalkine Group) cannot and do not warrant the accuracy, completeness, timeliness, merchantability, or fitness for a particular purpose of the content or the website, and to the extent permitted by law, Kalkine Group hereby disclaims any and all such express or implied warranties. Kalkine Group shall NOT be held liable for any investment or trading losses you may incur by using the information shared on our website.
