


Highlights
- In FY25, the company completed five acquisitions: three in Southeast Asia’s medical technology sector and two in animal care.
- The acquisitions are expected to add AUD 330 million in revenue on a full-year basis at a cost of AUD 210 million.
- The company expects to achieve underlying EBITDA of AUD 615–635mn in FY26.
EBOS Group Limited (ASX:EBO) is an Australasian marketer, wholesaler, and distributor of healthcare, medical, and pharmaceutical products. The company also owns and distributes animal care brands across Australasia.
Financial Performance
In the financial year 2025 (FY25), the company reported statutory revenue of AUD 12,267 million, down 7.0% from AUD 13,189 million in FY24. Statutory NPAT reached AUD 215 million in FY25, down from 20.8% from AUD 272 million in FY24. Free cash flow for the period increased by 18.7% YoY to AUD 273 million from AUD 230 million in FY24, partly offset by new customers, acquisitions, and higher margins.
- In FY25, the company completed five acquisitions three in Southeast Asia’s medical technology and two in animal care (Next Generation Pet Foods and SVS)—worth about AUD 210 million, expected to add AUD 330 million in annualised revenue.
Business Update
Through an ASX update dated 15 September 2025, EBO announced that it issued 5,697 ordinary shares at NZD 31.96 under its Employee Share Plan (0.0028% of total shares) on 15 September 2025.
Key Positives and Negatives
The company’s quick ratio improved to 0.67x in FY25 from 0.57x in FY24 and debt-to-equity dropped to 0.59x from 0.67x. However, return on equity declined to 8.3% from 11.1%, and net margin fell to 1.8% from 2.1%.
Business Outlook
The company expects to achieve FY26 underlying EBITDA of AUD 615–635mn, about 7% midpoint growth. Around AUD 360mn are expected to be invested over FY23–FY26 in the Distribution Centre Renewal Program, aimed at 20% capacity uplift, enhanced cold storage, and reduced cost-to-serve.
FY26 capital expenditure is expected to reach AUD 130–140mn, marking the conclusion of the major distribution centre renewal program. Annual capex is projected to decline by 30%, supporting free cash flow and capital allocation flexibility.
Share Performance of EBO
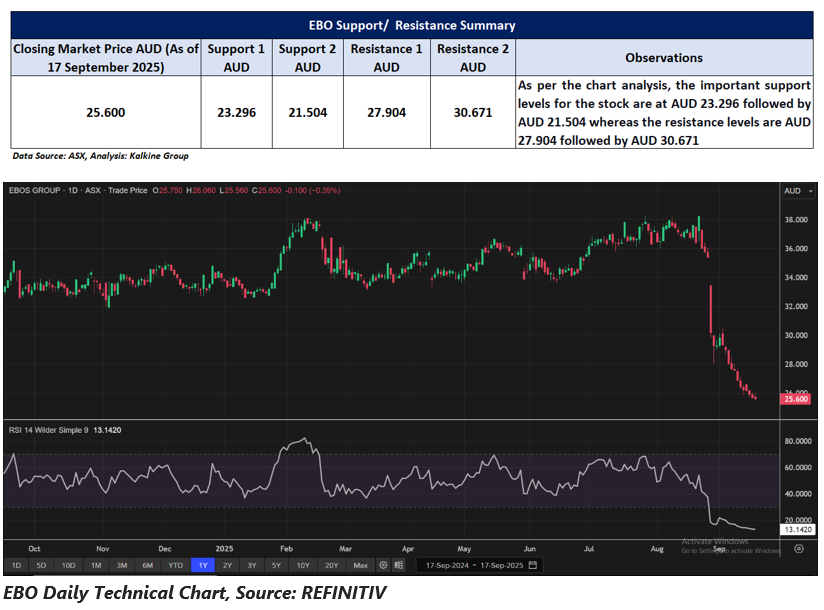
EBOS Group shares declined by 0.39% to close at AUD 25.60 per share on 17 September 2025. In one year, the stock has fallen 23.28% and it is down 24.82% over six months. On a weekly basis, the stock slipped 3.14%. Month-to-date, shares are lower by 12.63%, while quarter-to-date they have declined 28.07%. Year-to-date, the stock is down 24.68%.
The 52-week high for EBOS Group is AUD 38.23, recorded on 21 August 2025, while the 52-week low is AUD 25.61, reached on 16 September 2025.
Support and Resistance Summary
Note 1: Past performance is neither an Indicator nor a guarantee of future performance.
Note 2: The reference date for all price data, and currency, is 17 September 2025. The reference data in this report has been partly sourced from EODHD/Others.
Technical Indicators Defined:
Support: A level at which the stock prices tend to find support if they are falling, and a downtrend may take a pause backed by demand or buying interest. Support 1 refers to the nearby support level for the stock and if the price breaches the level, then Support 2 may act as the crucial support level for the stock.
Resistance: A level at which the stock prices tend to find resistance when they are rising, and an uptrend may take a pause due to profit booking or selling interest. Resistance 1 refers to the nearby resistance level for the stock and if the price surpasses the level, then Resistance 2 may act as the crucial resistance level for the stock.
Disclaimer
This article has been prepared by Kalkine Media, echoed on the website kalkinemedia.com/au and associated pages, based on the information obtained and collated from the subscription reports prepared by Kalkine Pty. Ltd. [ABN 34 154 808 312; AFSL no. 425376] on Kalkine.com.au (and associated pages). The principal purpose of the content is to provide factual information only for educational purposes. None of the content in this article, including any news, quotes, information, data, text, reports, ratings, opinions, images, photos, graphics, graphs, charts, animations, and video is or is intended to be, advisory in nature. The content does not contain or imply any recommendation or opinion intended to influence your financial decisions, including but not limited to, in respect of any particular security, transaction, or investment strategy, and must not be relied upon by you as such. The content is provided without any express or implied warranties of any kind. Kalkine Media, and its related bodies corporate, agents, and employees (Kalkine Group) cannot and do not warrant the accuracy, completeness, timeliness, merchantability, or fitness for a particular purpose of the content or the website, and to the extent permitted by law, Kalkine Group hereby disclaims any and all such express or implied warranties. Kalkine Group shall NOT be held liable for any investment or trading losses you may incur by using the information shared on our website.
