


_06_19_2026_12_34_15_139937.jpg)

Highlights
- EBOS is an Australasian distributor, wholesaler, and marketer of pharmaceutical, medical and healthcare products
- EBOS’ statutory revenue increased by 7.1% YoY, and underlying EBITDA grew by 8.3% YoY in 1HFY24
- The latest half witnessed higher sales of hospital medicines
EBOS Group Limited (ASX:EBO) is an ASX-listed healthcare equipment and services company. It operates as an Australasian distributor, wholesaler, and marketer of pharmaceutical, medical, and healthcare products. The company is also an Australasian animal care brand owner, product marketer, and distributor.
In the first half of the financial year 2024 (1HFY24) ended 31 December 2023, the company reported a 7.1% YoY rise in statutory revenue to AUD 6,582.5 million, driven by increased sales of hospital medicines and the performance of the medical technology division.
Underlying EBITDA during the reported period grew by 8.3% YoY to AUD 313.2 million. Continuous cost-cutting initiatives and higher revenue from the healthcare business supported the growth of underlying EBITDA in 1HFY24.
During the reported period, underlying net profit after tax stood at AUD 152.4 million, up 7.6% over the previous corresponding period.
Recent business update
On 2 April 2024, through an ASX update, the company announced that on 29 March 2024, 1,340 performance rights were ceased as conditions related to the exercise of the rights were not met.
On 22 March 2024, the company informed that under a dividend distribution plan, 1,399,233 shares were issued on the same date.
Outlook
In FY24, the company expects to sustain organic earnings growth across the healthcare and animal care business segments. Moreover, the company intends to undertake additional bolt-in acquisitions.
The company expects capital expenditure in FY24 to be slightly higher than FY23.
Share performance of EBO
EBO shares closed 0.719% lower at AUD 31.74 apiece on 3 April 2024, with a market capitalilsation of AUD 6.17 billion. In the last one year, EBO’s share price has declined by 24.96%, while in the last three months it has decreased by 4.97%.
The 52-week high of EBO is AUD 43.77, recorded on 3 April 2023, while the 52-week low is AUD 30.810, recorded on 27 March 2024.
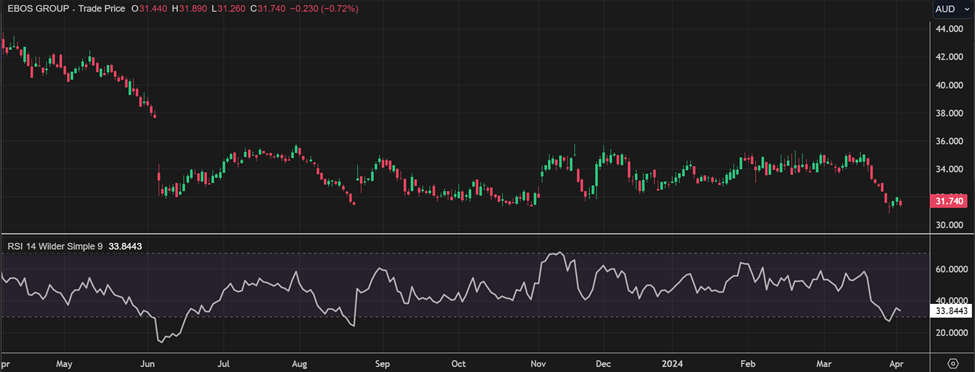
EBO Daily Technical Chart, Source: EODHD/Others
Note 1: Past performance is neither an Indicator nor a guarantee of future performance.
Note 2: The reference date for all price data, and currency, is 03 April 2024. The reference data in this report has been partly sourced from EODHD/Others.
Disclaimer
This article has been prepared by Kalkine Media, echoed on the website kalkinemedia.com/au and associated pages, based on the information obtained and collated from the subscription reports prepared by Kalkine Pty. Ltd. [ABN 34 154 808 312; AFSL no. 425376] on Kalkine.com.au (and associated pages). The principal purpose of the content is to provide factual information only for educational purposes. None of the content in this article, including any news, quotes, information, data, text, reports, ratings, opinions, images, photos, graphics, graphs, charts, animations, and video is or is intended to be, advisory in nature. The content does not contain or imply any recommendation or opinion intended to influence your financial decisions, including but not limited to, in respect of any particular security, transaction, or investment strategy, and must not be relied upon by you as such. The content is provided without any express or implied warranties of any kind. Kalkine Media, and its related bodies corporate, agents, and employees (Kalkine Group) cannot and do not warrant the accuracy, completeness, timeliness, merchantability, or fitness for a particular purpose of the content or the website, and to the extent permitted by law, Kalkine Group hereby disclaims any and all such express or implied warranties. Kalkine Group shall NOT be held liable for any investment or trading losses you may incur by using the information shared on our website.
