


_06_19_2026_12_34_15_139937.jpg)

Highlights
- The company reported USD 8.48 billion in revenue for 1HFY25, reflecting a 5% YoY growth, while NPAT increased by 6% YoY to USD 2.01 billion.
- Megan Clark AC acquired 200 ordinary shares for USD 50,012.
- In FY25, CSL expects revenue to increase by 5-7% over FY24 at constant currency.
CSL Limited (ASX:CSL) is an ASX-listed biopharmaceuticals company, engaged in the development, research, distribution and marketing of biopharmaceutical vaccines and products. In the half-year ended 31 December 2024 (1HFY25), CSL reported total revenue of USD 8.48 billion, reflecting a 5% YoY increase from USD 8.05 billion in 1HFY24. The company’s Net Profit After Tax (NPAT) rose 6% YoY in 1HFY25 to USD 2.01 billion, compared to USD 1.90 billion in the previous period. Notably, CSL's cash and cash equivalents surged 51% YoY to USD 1.52 billion.
During the reported period, sales growth was primarily driven by CSL Behring, which recorded a 10% YoY revenue increase, and a 15% YoY rise in immunoglobulin (Ig) sales.
Change in Director’s Interest
Through an ASX announcement dated 17 March 2025, the company notified that the company’s director, Dr. Megan Clark AC had acquired 200 ordinary shares for USD 50,012.
Outlook for FY25
In FY25, the company expects revenue to increase by 5-7% over FY24 at constant currency. Meanwhile, NPAT is anticipated to be between USD 3.2 billion and USD 3.3 billion, representing a 10-13% YoY growth.
Key initiatives for the fiscal year include:
- Enhancing Gross Margins: The company is focused on completion of the RIKA roll-out across CSL Plasma by the end of FY25.
- Core Businesses: CSL expects continued growth in its immunoglobulin franchise, expansion of CSL Vifor, and a well-defined strategy to increase market share for CSL Seqirus, despite challenging market conditions.
Top 10 shareholders of CSL
The top 10 shareholders of CSL have around 21.42% shareholding in the company. State Street Global advisors Australia Ltd. and the Vanguard Group, Inc. have the highest stake in the firm with a shareholding of 5.01% and 4.98%, respectively.
Share performance of CSL
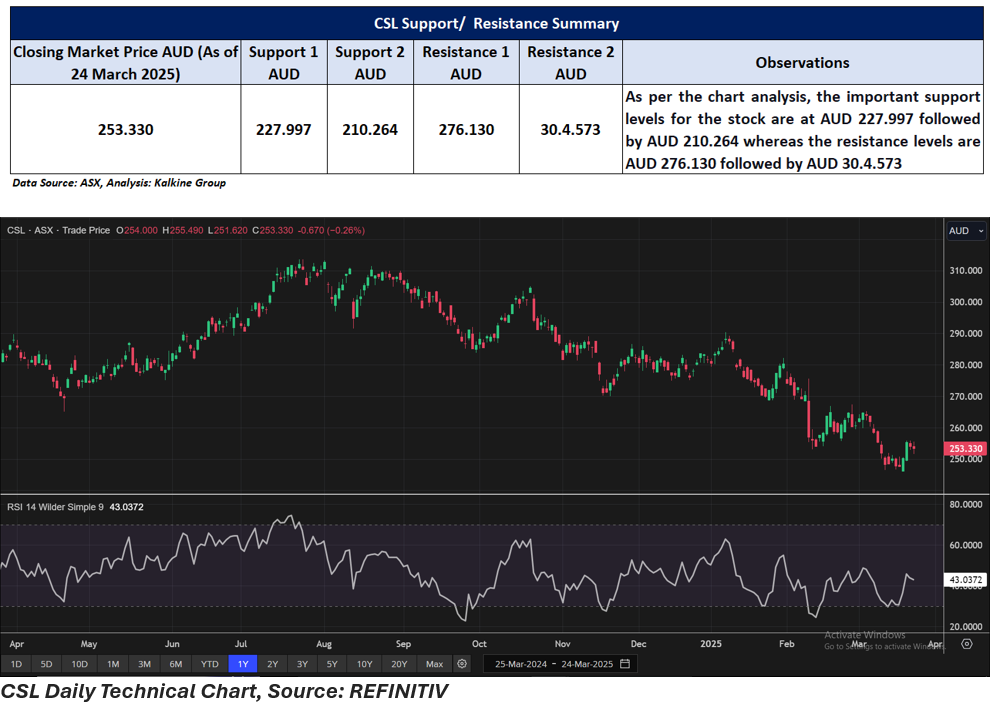
CSL shares closed 0.26% lower at AUD 253.33 per share on 24 March 2025. The share price has dropped by almost 9.83% in a year and gained 2.20% in a week.
52-week high of CSL is AUD 313.55, recorded on 24 July 2024 and 52-week low is AUD 246.20, recorded on 19 March 2025.
Support and Resistance Summary
Note 1: Past performance is neither an Indicator nor a guarantee of future performance.
Note 2: The reference date for all price data, and currency, is 24 March 2025. The reference data in this report has been partly sourced from EODHD/Others.
Technical Indicators Defined:
Support: A level at which the stock prices tend to find support if they are falling, and a downtrend may take a pause backed by demand or buying interest. Support 1 refers to the nearby support level for the stock and if the price breaches the level, then Support 2 may act as the crucial support level for the stock.
Resistance: A level at which the stock prices tend to find resistance when they are rising, and an uptrend may take a pause due to profit booking or selling interest. Resistance 1 refers to the nearby resistance level for the stock and if the price surpasses the level, then Resistance 2 may act as the crucial resistance level for the stock.
Disclaimer
This article has been prepared by Kalkine Media, echoed on the website kalkinemedia.com/au and associated pages, based on the information obtained and collated from the subscription reports prepared by Kalkine Pty. Ltd. [ABN 34 154 808 312; AFSL no. 425376] on Kalkine.com.au (and associated pages). The principal purpose of the content is to provide factual information only for educational purposes. None of the content in this article, including any news, quotes, information, data, text, reports, ratings, opinions, images, photos, graphics, graphs, charts, animations, and video is or is intended to be, advisory in nature. The content does not contain or imply any recommendation or opinion intended to influence your financial decisions, including but not limited to, in respect of any particular security, transaction, or investment strategy, and must not be relied upon by you as such. The content is provided without any express or implied warranties of any kind. Kalkine Media, and its related bodies corporate, agents, and employees (Kalkine Group) cannot and do not warrant the accuracy, completeness, timeliness, merchantability, or fitness for a particular purpose of the content or the website, and to the extent permitted by law, Kalkine Group hereby disclaims any and all such express or implied warranties. Kalkine Group shall NOT be held liable for any investment or trading losses you may incur by using the information shared on our website.
