


S&P/ASX 200 VIX (A-VIX) measures implied volatility of the S&P/ASX 200 for the near-term volatility. An increase in A-VIX signifies high uncertainty in the market and decrease in A-VIX indicates investorsâ confidence over the market (minimal change in the next 30 days). A-VIX can be described as an annualised standard deviation (SD) %, which can further convert into a shorter time period.
At the time of writing A-VIX traded at 16.2 (August 12, 2019, AEST: 1:35 PM), which can be considered as a mid-volatility range. It can be converted into a monthly figure: 16.2% * square root (1/12) = 4.67%, which means that S&P/ASX 200 is expected to be in the range of +- 4.67% in the next 30 days. Presently, S&P/ASX 200 is trading at 6,576.6 (August 12, 2019, AEST: 1:35 PM), and as per the calculations the index is expected to be in the range of (6,269.473-6,888.72) in the next thirty days.
This Year-To-Date, A-VIX on January 2, 2019 was reported at 19.414 and then it declined to 10.440 on April 16, 2019. After rising to the level of 16.085 on June 3, 2019, A-VIX fell again to 10.275 on July 5, 2019. Owing to the geopolitical tensions amid trade war, A-VIX has again risen to the present level of 16.2. S&P/ASX 200 made its all-time high at $6,875.50 on July 30, 2019 and since then it has corrected to the present level of $6,576.6, which is a ~4.34% down.
In an increasing volatile situation, the dividend stocks provide a safe investment opportunity in the equity markets. Some of the high dividend paying stocks are Alumina Limited (ASX:AWC), AMP Limited (ASX:AMP), Harvey Norman Holdings Limited (ASX:HVN), Westpac Banking Corporation (ASX:WBC), National Australia Bank Limited (ASX:NAB) and Bendigo and Adelaide Bank Limited (ASX:BEN).
Alumina Limited (ASX:AWC)
Alumina Limited (ASX:AWC) has interest in aluminium smelting and bauxite mining and more. In its FY2018 report, AWC highlighted that its revenue from the continuing operations was reported at US$1.6 Mn as compared to US$0.6 Mn in FY2017. Its profit for the year attributable to the owners of Alumina Limited was reported at US$635.4 Mn as compared to US$339.8 Mn in FY2017. The total comprehensive income for the year attributable to the owners of Alumina Limited was reported at US$417.7 Mn as compared to US$438.5 Mn in FY2017. Its annual dividend yield was recorded at 13.73 percent.
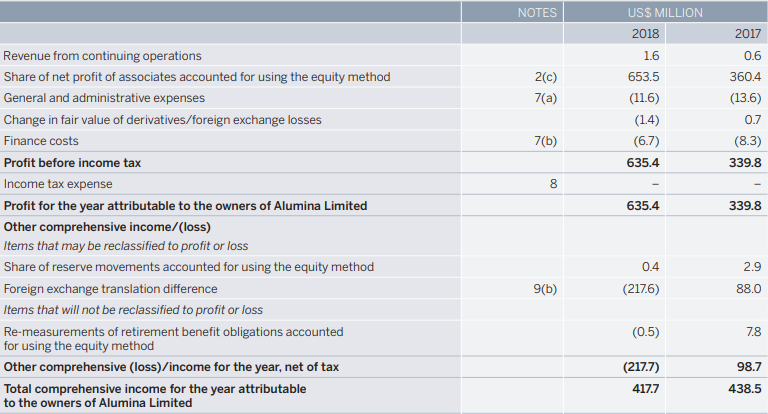 FY2018 Income Statement (Source: Companyâs Report)
On the stock information front
On 12 August1 2019, AWCâs stock is trading at A$2.260, down by 0.877% (at AEST 1:28 PM), with the market cap of ~A$6.57 Bn. Its current PE multiple is at 7.280x and its last EPS was noted at A$0.313. Its 52 weeks high and 52 weeks low stand at A$3.200 and A$2.120, respectively, with an annual average volume of 12,494,838. It has generated an absolute return of -22.18% for the last one year, -11.63% for the last six months, and 3.64% for the last three months.
AMP Limited (ASX:AMP)
AMP Limited (ASX:AMP) is a wealth management entity with a growing global investment management business and a developing retail banking business. AMP reported retained business operating earnings for H1FY19 at A$316 Mn as compared to A$404 Mn in the previous corresponding period. The underlying profit for H1FY19 was reported at A$309 Mn as compared to A$495 Mn in the previous corresponding period. AMPâs annual dividend yield was noted at 7.25%.
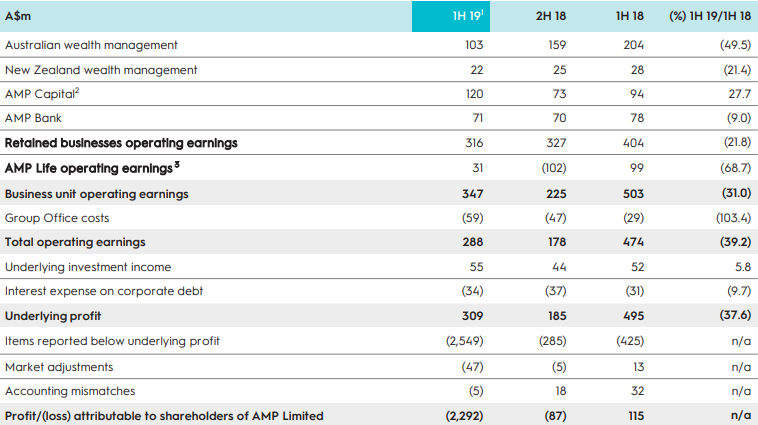 H1FY19 Income Statement (Source: Companyâs Report)
On the stock information front
On 12 August 2019, AMPâs stock was trading at A$1.885, down by 2.332% (at AEST 1:30 PM), with the market cap of ~A$5.69 Bn. Its current PE multiple is at 193.000x and its last EPS was noted at A$0.010. Its 52 weeks high and 52 weeks low stand at A$3.525 and A$1.715, respectively, with an annual average volume of 16,534,920. It has generated an absolute return of -44.22% for the last one year, -20.25% for the last six months, and -12.67% for the last three months.
Harvey Norman Holdings Limited (ASX:HVN)
Harvey Norman Holdings Limited (ASX:HVN) is into integrated retail, franchise and so forth. In its H1FY19 report, HVN highlighted that the sale of products to customers was reported at $1.18 Bn as compared to $1.02 Bn in the previous corresponding period. The profit after tax for the period was reported at $226.21 Mn as compared to $209.78 Mn in the previous corresponding period. The annual dividend yield of HVN was of 6.99%.
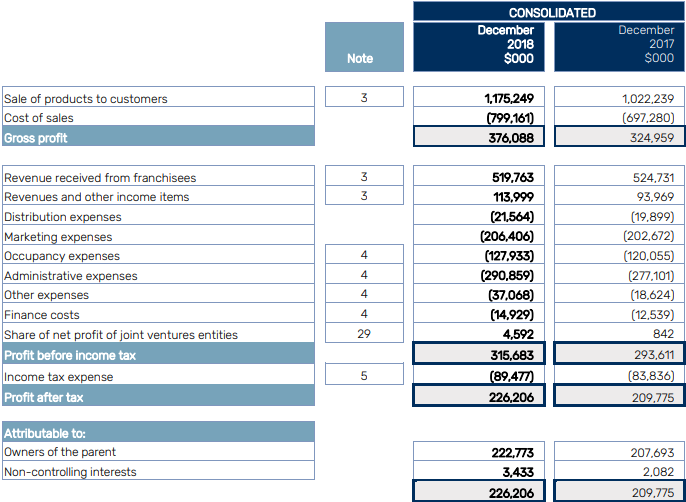 H1FY19 Income Statement (Source: Companyâs Report)
On the stock information front
On 12 August 2019, HVNâs stock was trading at A$4.405 up by 2.681% (at AEST 1:48 PM), with the market cap of ~A$5.06 Bn. Its current PE multiple is at 12.400x and its last EPS was noted at A$0.346. Its 52 weeks high and 52 weeks low stand at $4.535 and $2.990, respectively, with an annual average volume of 3,103,500. It has generated an absolute return of 26.72% for the last one year, 23.28% for the last six months, and 7.79% for the last three months.
Westpac Banking Corporation (ASX:WBC)
Westpac Banking Corporation (ASX:WBC) is involved in provisioning the financial services such as deposit taking, investment portfolio management and advice, superannuation and funds management, leasing finance, lending, foreign exchange services, etc. WBC in its H1FY19 report highlighted that its net profit (reported) stood at $3,173 Mn, which is 24% down as compared to previous corresponding period. Its cash earnings (reported) for the period was reported at $3,296 Mn, which is a 22% down as compared to previous corresponding period. The annual dividend yield of WBC was recorded at 6.66 percent.
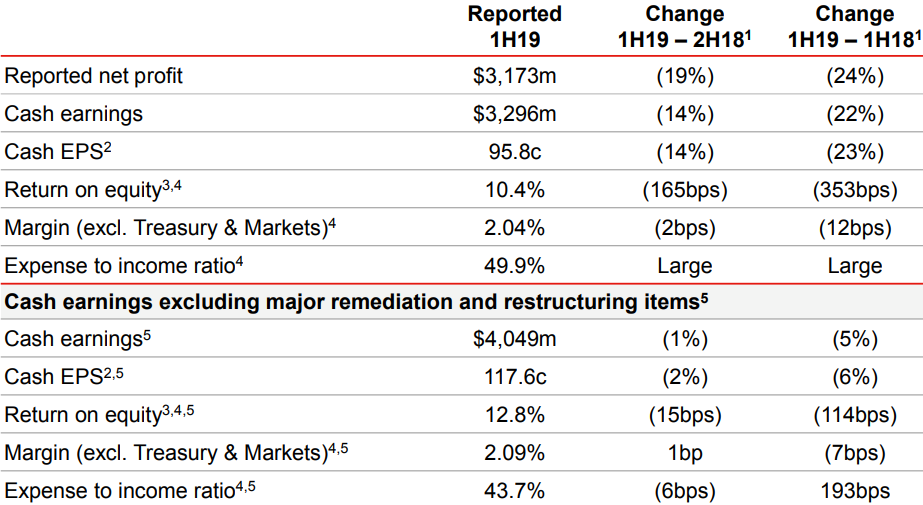 H1FY19 Key Financial Metrics (Source: Companyâs Report)
On the stock information front
On 12 August 2019, WBCâs stock was trading at A$28.360 up 0.532%, with the market cap of ~A$98.45 Bn. Its current PE multiple is at 13.690x and its last EPS was noted at A$2.061. Its 52 weeks high and 52 weeks low stand at A$30.440 and A$23.300, respectively, with an annual average volume of 7,133,692. It has generated an absolute return of -4.34% for the last one year, 6.94% for the last six months, and 4.25% for the last three months.
National Australia Bank Limited (ASX:NAB)
National Australia Bank Limited (ASX:NAB) in its half-yearly report highlighted that its net operating income for the half year period (ended on March â19) was reported at $8.874 Bn as compared to $9.09 Bn in the previous corresponding period. Its cash earnings for the period was reported at $2.95 Bn as compared to $2.76 Bn in the previous corresponding period. NABâs annual dividend yield was noted at 6.58 percent.
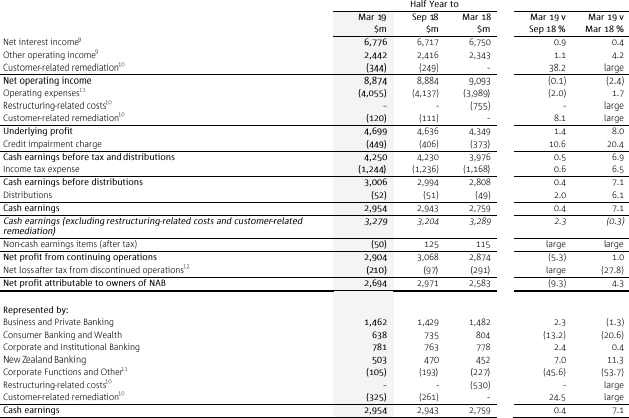
NABâs Financial Performance Data (Source: Companyâs Report)
On the stock information front
On 12 August 2019, NABâs stock was trading at A$27.715, up by 0.235% (at AEST 2:05 PM), with the market cap of ~A$79.72 Bn. Its current PE multiple is at 13.0x and its last EPS was noted at A$2.051. Its 52 weeks high and 52 weeks low stand at A$29.000 and A$22.520, respectively, with an annual average volume of 7,094,981. It has generated an absolute return of -1.29% for the last one year, 13.55% for the last six months, and 6.72% for the last three months.
Bendigo and Adelaide Bank Limited (ASX:BEN)
Bendigo and Adelaide Bank Limited (ASX:BEN) in its half- yearly report highlighted that its statutory NPAT was reported at $203.2 Mn as compared to $231.7 Mn in the previous corresponding period. Its cash earnings for the period was reported at $219.8 Mn as compared to $225.3 Mn in the previous corresponding period. BENâs annual dividend yield was noted at 6.51 percent.
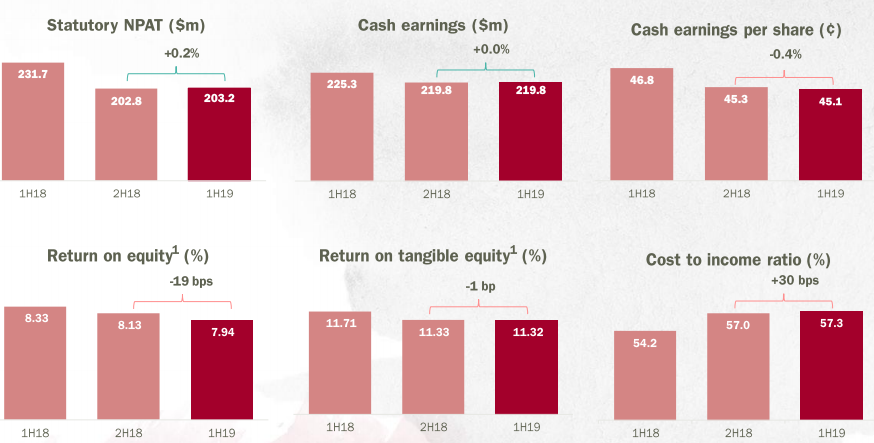 BENâs Key Financial Metrics (Source: Companyâs Report)
On the stock information front
On 12 August 2019, AWCâs stock was trading at A$11.08, up by 3.07% (at AEST 2:05 PM), with the market cap of ~A$5.28 Bn. Its current PE multiple is at 12.340x and its last EPS was noted at A$0.871. Its 52 weeks high and 52 weeks low stand at $11.740 and $9.370, respectively, with an annual average volume of 1,387,152. It has generated an absolute return of -6.99% for the last one year, -4.94% for the last six months, and 3.16% for the last three months.
Disclaimer
This website is a service of Kalkine Media Pty. Ltd. A.C.N. 629 651 672. The website has been prepared for informational purposes only and is not intended to be used as a complete source of information on any particular company. Kalkine Media does not in any way endorse or recommend individuals, products or services that may be discussed on this site. Our publications are NOT a solicitation or recommendation to buy, sell or hold. We are neither licensed nor qualified to provide investment advice.
