


Gold spot is marking high levels and shinning brighter than ever, and investment banks such as Credit Suisse, Goldman Sachs anticipate that gold price could rise further till USD 2,000 per ounce. The gold spot has recently hit a record high of $2,776.37 (intraday high on 24 March 2020), while crossing a seven year high in the international market.
To Know More, Do Read: Gold Shatters 7-Year High, Joy Ride Coming For ASX-listed Gold Stocks?
So, the question, which now arises is why gold is acting as the safety net and why is there a lot of money flowing into gold?
Suggested Read: Why is Gold a Consensus Buy and Why are Money Managers Buying It?
The answer to all the whys pertaining gold is the same, i.e., the ongoing market turmoil across the globe due the COVID-19 outbreak, which is estimated to further dent the global economic growth. Plus, the constant act of money printing by the Global Central Banks.
In the status quo, the International Monetary Fund anticipated an economic contraction of 3 per cent across the globe with the United States, United Kingdom, France, Italy, Spain, and Japan further expected to witness a large contraction due to the pandemic.
To Know More, Do Read: Why US-Backed OPEC+ Production Cut Is a Failed Stimulus in the Status Quo?
In simple terms, the reason is sufficient enough for the gold spot to test multiple peaks time-to-time and is also a major contributor in the forecast of many forecasters.
Today at Kalkine, we would analyse the domestic price action of gold to decipher the chart patterns and understand how the prices might react in the short to medium term. We would use technical analysis to assess the current market behaviour and future possibilities.
So, Shall We Begin?
Gold Spot on a Weekly Chart

XAU On A Weekly Chart (Source: Thomson Reuters)
On applying Ichimoku clouding technique on the weekly chart, it could be seen that the gold spot is currently trading above Span A, which is the mean value of the conversion line (dark blue line) and the base line (sky blue line) with a positive cross between the conversion line (which is the mean value of 9-week high and low) and the base line (which is the mean value of 26-week high and low).
Also, the spread between Span A and Span B (which is the mean value 52-week high and low) is still large suggesting that the current ongoing uptrend has more steam left to tap. The 14-week RSI is in line with the price action and its value above the mean coupled with current step up on the weekly chart suggest that there is a strong presence of bullish sentiments around the gold spot.
To Know the Technical Levels of USD-Dominated Gold, Do Read: Volatility the Pulse of the Market: A Reading of Gold Pulse Across Multiple Time Frame
Gold Spot on Daily Chart
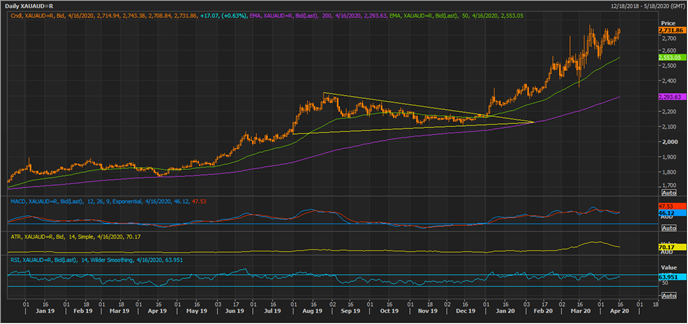
XAU On A Daily Chart (Source: Thomson Reuters)
On the daily chart it could be seen that the gold spot is currently trading above both its long-term exponential moving average of 200-days and medium-term exponential moving average of 50-days, which are at $2,293.63 and $2,553.05, respectively.
Over the short-term, the 50-days EMA should act as the immediate support for gold. The moving average convergence and divergence or MACD indicator is giving a positive signal on the monthly timeframe, and it should also be noticed that while the gold spot is the rise, its average true range (or ATR) is trending down, suggesting that the recent spiked volatility in gold is now somewhat losing strength.
While the MACD is giving a positive signal and ATR is suggesting lower price fluctuations ahead, the 14-month Relative Strength Index is above its mean value, reflecting the current setup is boosting bulls confidence and bulls are currently dominating the gold spot.
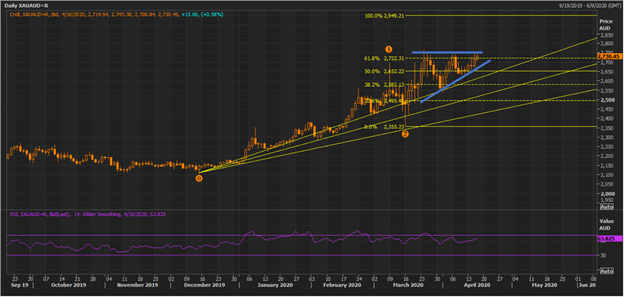
XAU On A Daily Chart (Source: Thomson Reuters)
On further connecting the wave points marked as 0,1, and 2 we projected Fibonacci series of resistance, which is currently showing that the gold spot is presently facing resistance at the 61.8 per cent of the projected level.
While the 61.8 per cent of the Fibonacci series is the immediate resistance for the gold spot, the 1/3 fraction of the Fibonacci fan, projected by connecting the recent low of the gold spot from its recent high, could be a good support area for gold.
Another interesting pattern that is emerging is an ascending triangle pattern, a continuation pattern. If the gold prices manage to break above the upper range of the pattern then one could see a fresh upside rally.
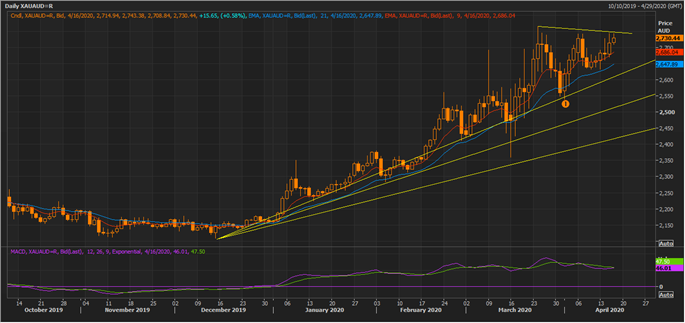
XAU On A Daily Chart (Source: Thomson Reuters)
The MACD is showing a slight positive signal with short-term average trying to cross the long-term average of the indicator.
Also, it should be noticed that the gold spot is currently trading above its short-term 9-day exponential moving average and medium-term 21-day exponential moving average. The gold spot is facing some short-term resistance at the downward sloping short-term trendline.
In the status quo, the gold spot has tested the primary support projected from the Fibonacci fan once (marked as 1), and these level should be considered as the short-term support level on the daily timeframe.
