


Highlights
Fortescue Ltd (ASX:FMG) operates in iron ore with increasing exposure to energy transition minerals
FMG has expanded its exploration footprint beyond Australia, spanning multiple global locations
Key financial indicators include revenue, gross margin, profit, debt position, and equity performance
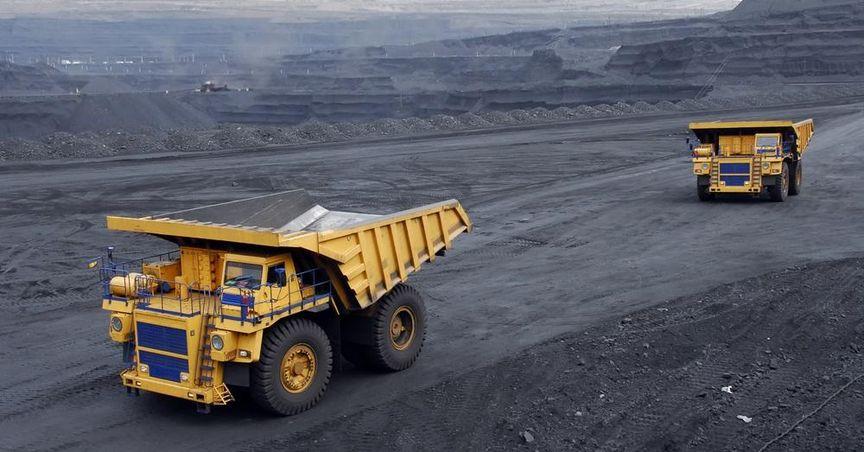
Fortescue Ltd (ASX:FMG), a major player within the iron ore industry, is listed on the ASX 200 index. The company’s operations span iron ore mining, exploration, and shipping, largely anchored in the Pilbara region of Western Australia. Over the years, Fortescue has scaled its production while simultaneously widening its scope across a broader range of minerals.
The company has diversified its resource base in alignment with global trends toward renewable technologies. Alongside its traditional iron ore business, Fortescue has intensified its exploration in copper, lithium, and rare earths. These activities now extend beyond Australia into South America and Central Asia, reflecting a significant expansion of its geographic footprint.
Revenue and Margin Performance
Revenue figures serve as the starting point when reviewing a company’s business momentum. Fortescue’s iron ore exports continue to form the bulk of its earnings, with large-scale shipments supporting the top line. The revenue trend, however, reflects broader market conditions and commodity price fluctuations, which impact figures year to year.
Gross margin, which measures profitability before overheads, has remained a critical focus. Fortescue’s margin outcomes underline the operational efficiency within its core mining and logistics infrastructure. These results are shaped by both cost control and the realised price of iron ore and associated commodities.
Profit Generation Over Time
Profit results provide insight into how efficiently the business converts its operations into earnings. In recent years, Fortescue’s profitability has followed the cyclical nature of the mining sector. Changing demand, geopolitical developments, and input costs contribute to variability across reporting periods.
The contrast between historical and recent profit figures points to the impact of pricing volatility and operating scale. Fortescue’s broader mining investments and cost structure also play a role in determining its year-end outcomes.
Capital Position and Financial Structure
Reviewing the balance sheet shows how well-positioned the company is to manage through fluctuations in the resource sector. Fortescue’s net debt profile is one aspect to examine, balancing total liabilities against available cash reserves. A lower net debt figure may indicate stronger liquidity, while higher levels can reflect ongoing project funding or infrastructure investment.
The debt to equity ratio is another metric reflecting the composition of capital used to finance operations. For Fortescue Ltd (ASX:FMG), equity continues to account for a greater portion of its capital structure, which aligns with a moderate approach to leverage.
Return on Equity and Performance Indicators
Return on equity highlights the efficiency with which Fortescue generates profit based on shareholder capital. A strong figure in this area points to a well-managed deployment of resources. Fortescue has historically delivered solid returns, supported by its streamlined production model and strategic cost control across sites.
The company’s return profile, when observed in tandem with other indicators, helps build a comprehensive view of its overall financial condition. These include assessments of capital usage, output scalability, and commodity market alignment.
