


Summary
- We have often heard that trend is a friend, and many investors ride trends to generate alpha and avoid beta, which emerges from the daily price fluctuations.
- However, prices could rise in an uptrend for a while before giving changing their direction or go into sideways consolidation.
- But there are several tools at the disposal of an investor or trader, which could reduce the probability of getting caught in such a trap.
- Volume is one such tool, which is widely used to avoid fishnets and make timely decision, provided one knows when, how, and what to look.
Volume is often considered as a secondary tool used with the price action to reach a decision to buy, sell, or stay neutral in a stock or any other asset, on which the study of technical analysis could be applied. Volume is a good proxy to understand the tone of the participation. Volume increases every time a new buy or sell contract is transacted, and often high volumes of trading reveals a lot about market sentiments or outlook over the security under consideration.
Volume analysis is basically defined as the examination of the number of shares or contracts of a security that have been traded during a trading session or a given period of time, and it acts as a confirmation signal in lot many cases; however, it is not sacrosanct.
While in general, a rising price trend with higher volume is considered as a bullish signal and a price uptick without good volume backing it up is usually considered to be on a weak footing. However, volume sometimes could be misleading as well, if one is not familiar with the nitty-gritty of the market.
Nitty Gritty of Volume Analysis
- Volume is a great tool to confirm a trend
As mentioned above, a rise in a price series if closely followed by a rise in volume, it acts as a great confirmation signal and suggests that the price series is in an relatively stronger uptrend and vice versa, as there is higher participation and thus better data/information study. A rising momentum in security often requires continuous enthusiasm from buyers with belief that there is more value despite the price moving up for them to make a buy decision and thus maintain the rally. A rising price series and declining volume could reflect a lack of interest, and in some cases, could even act as a warning signal for a trend reversal.
- Spiked Volumes could Identify Exhaustion Moves
Exhaustion is the end move of an upside or downside rally and involves a situation when a majority of participants holding a position in the direction of the trend let few investors take the other side of the transaction, i.e., position holders in the direction of the trend close their positions.
Exhaustion moves are usually associated with a sharp increase in price along with a sharp surge in volume, which could trap some novice traders into a belief that the market is showing further interest in the direction of the trend, prompting them to enter them in the direction of the trend, which eventually turns loses steam and a change in trend reversal or a sideways consolidation move is witnessed.
- Volume Usually Confirms Price Reversal
After a downside or upside rally, if a security or any other tradable asset begins to consolidate with little volatility or price fluctuations, followed by large volumes, that often indicates that a price reversal is underway; however, there have been many instances and evidence which defers, and it has also been observed that such price and volume pattern breaks out into continuation of the trend rather than a reversal.
Such consolidation setup with lower volatility and large volume often requires measuring the market sentiment with other strength measuring tools such as market breadth, i.e., the ratio of advance and decline lines.
- Volume and Breakouts
Increased volume often occurs with a breakout and heavier trading demonstrates that other market players are acting in the direction of the new trend, and there is sufficient power behind the breakout.
Volume-Based Technical Indicators
- On Balance Volume (or OBV)
OBV is a volume-based momentum indicator first developed by Joseph Granville out of the belief that volume is the key force behind markets. The indicator measures momentum or the buying the selling pressure as a cumulative indicator by adding volume to the previous value on an up day, subtracting volume from the previous value on a down day, and keep it unchanged on no change.
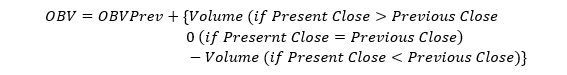
The momentum or the market sentiment can be gauged by observing the direction of the price trend in relation to the OBV, i.e. if prices are trailing higher and OBV is moving in tandem to make higher peaks, the chances that the upward trend would continue increases, and vice versa.
The traders usually look for divergence between the price action and the indicator to spot a reversal.
- Chaikin Money Flow (or CMF)
CMF is a volume-weighted average of accumulation and distribution first developed by Marc Chaikin on the belief that rising volume should be followed by rising volume; thus, the indicator focuses on expanding volume if price finishes in their daily range.
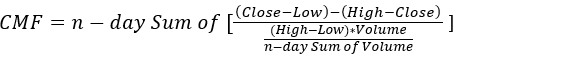
The momentum or the market sentiment can be gauged by observing the value of CMF above or below the zero line. A CMF value above the zero line signals sign of strength and vice versa.
Practical Application
Here we are presenting a chart, which includes many of the suggested observations; however, we would try to encourage our readers to explore more such charts and make their own habit of identifying such patterns to stay ahead of the curve.
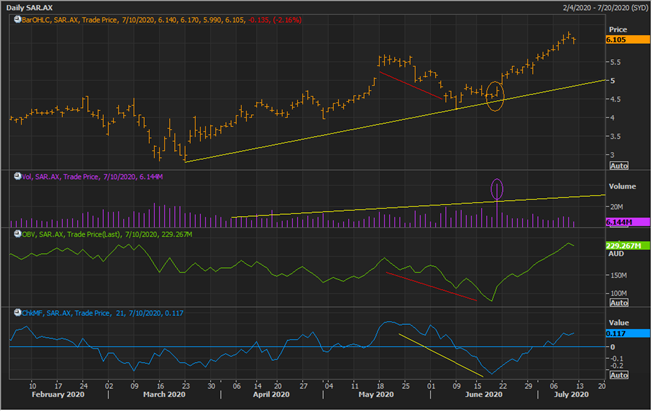
Saracen Mineral Holdings Limited Daily Chart (Source: EODHD/Others Eikon Thomson Reuters)
On the above chart, it can be seen that the major trend remained an uptrend and the price kept on surging, which was closely supported with a rise in volume.
Furthermore, while rallying upwards, the stock corrected, which was further followed by a decline in OBV and below zero CMF.
However, soon after the spike volume reversal took place with the emergence of an inside bar (learn and grow!!), which was further followed by a spike in OBV and above zero line value of CMF with the price again continuing its momentum.
