


Gold price is retracing back, with Gold spot correcting from its recent high of US$1437.20 (Dayâs high on 3rd July 2019). The retracement in gold is dragging down the gold miners, who enjoyed the recent gold rush to ascend.
Gold on Charts:
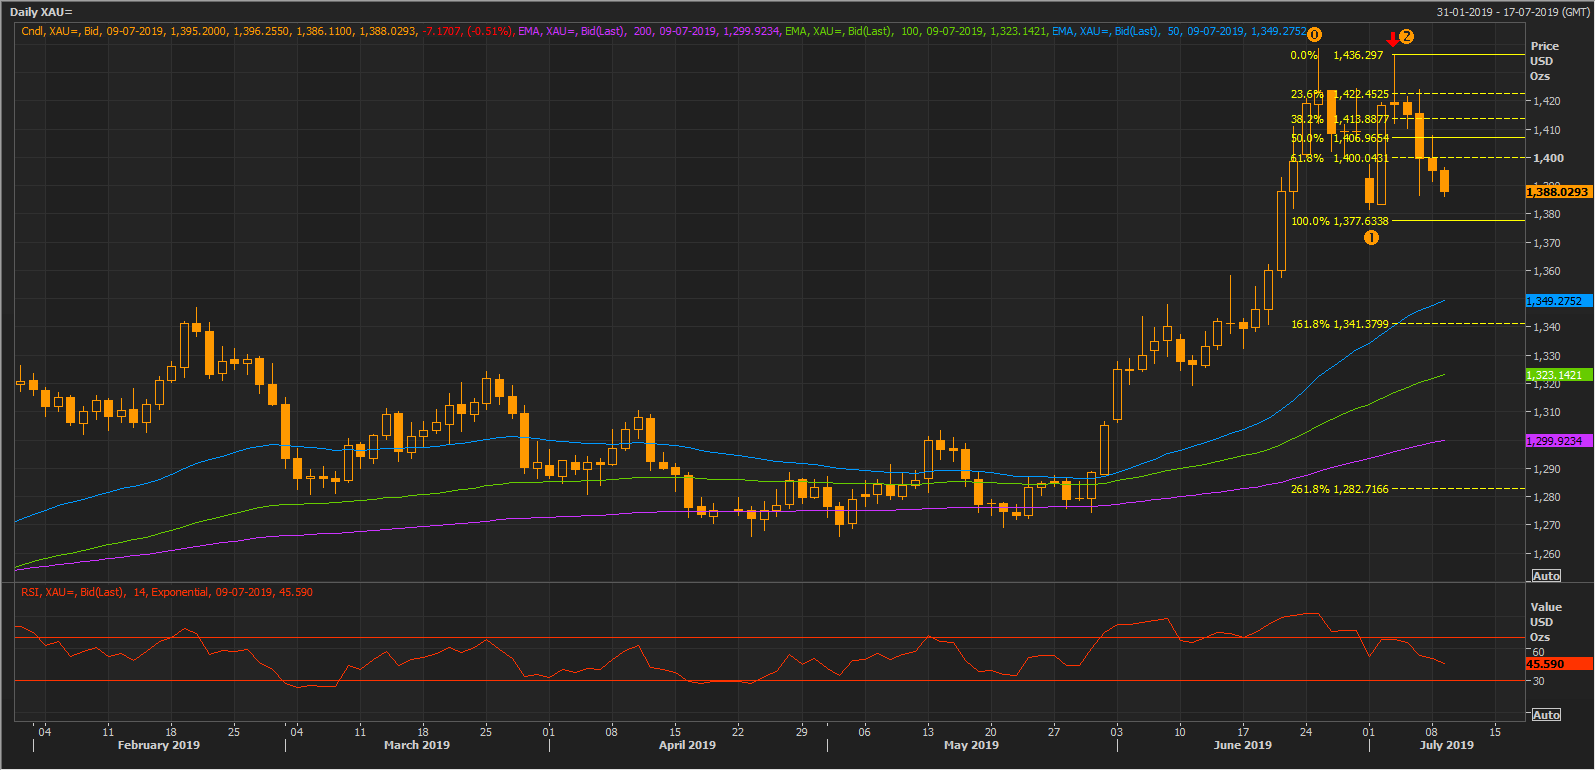
XAU Daily Chart (Source: Thomson Reuters)
On the daily chart, the gold price dropped and reverted back twice from almost the same level. Post hitting the level of US$1438.99 on 25th June 2019, gold retraced back, likewise, the gold price again rose to the level of US$1437.20 and retraced back.
The failure of gold to breach above the previous high of US$1438.99 suggests that US$1437.20 level is offering resistance to the gold price.
However, the gold price is currently trading above its 200, 100, and 50-day exponential moving average, which are at US$1299.92, US$1323.14, and US$1349.27 respectively. Any of the moving average mentioned above could support the gold price if the it were to correct further.
The primary support of gold is intact at the 100.0 per cent projected Fibonacci Series, which is projected from the points marked as 0,1,2 on the chart shown above. The 100.0 per cent projected level of US$1377.63 would act as the primary support, and investors should keep a close eye around the level as a break below or failure to do so would decide further price actions in gold.
ASX-listed Gold Miners on Charts:
Gold Road Resources Limited (ASX: GOR)
The recent gold rush augured well for the share price of the company backed with high production volumes and the share price rose to the level of A$1.190 (Dayâs high on 8th July 2019). The crossing of share price above the level of A$1.140 proved to be milestone for the company, as the price increase took the market cap of the company above $1 billion.
GOR on Charts:
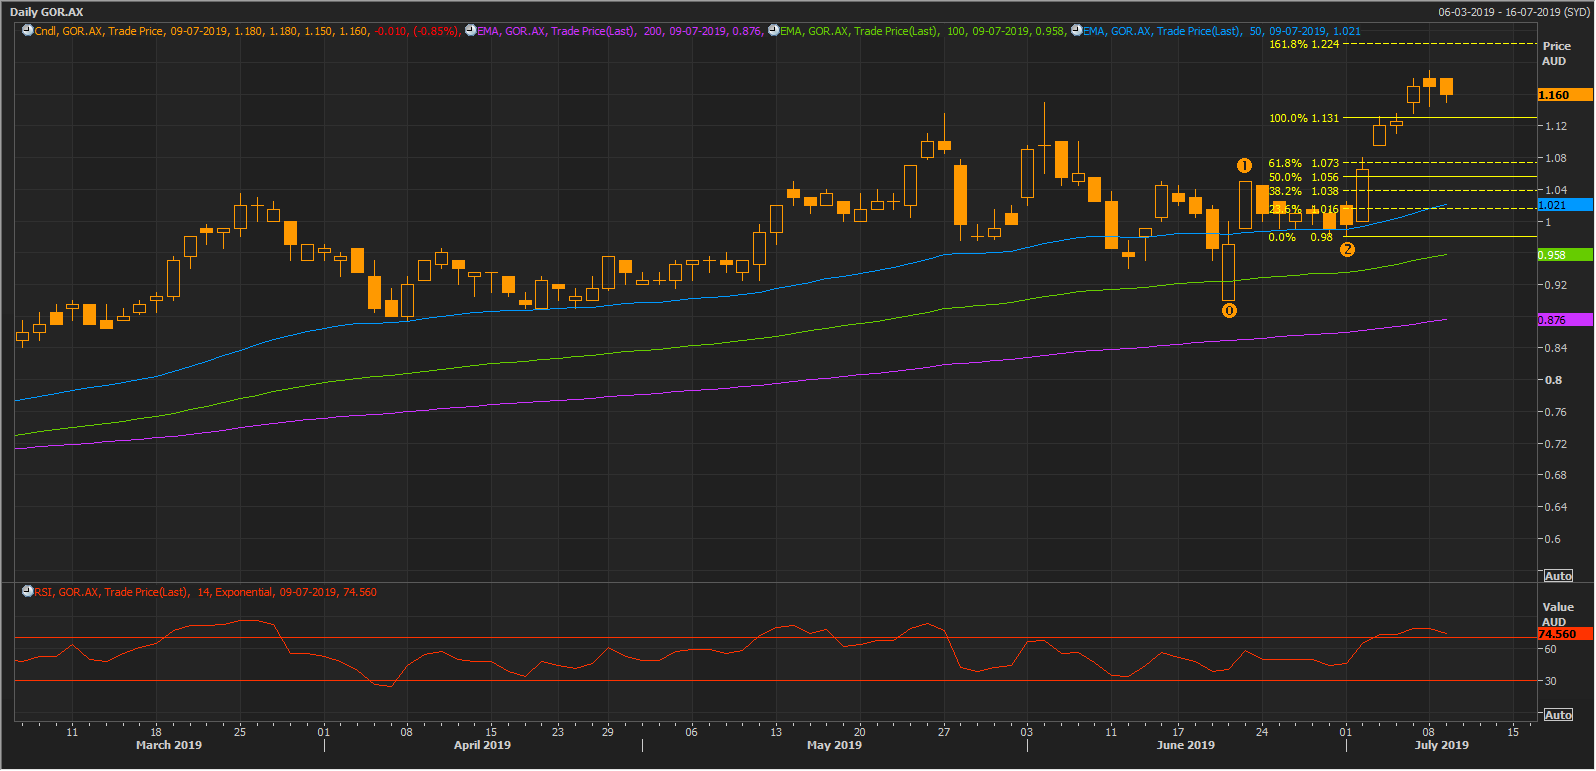

GOR Daily Chart (Source: Thomson Reuters)
On the daily chart, the share price of the company is moving in a continuous uptrend, and is trading above its 200, 100, and 50-day exponential moving averages, which are at A$0.876, A$0.958, and A$1.021 respectively.
On projecting the Fibonacci series from the points marked as 0,1,2 on the chart shown above, the share price of the company revealed its primary support at the 100.0 per cent projected level, which stood at A$1.131. The short-term moving average of 50-days could act as the secondary support for the share price of the company, and investors should monitor the level of A$1.131 to A$1.021, as a sustain in the range or break below would decide further price actions in it.
Independence Group NL (ASX: IGO)
The share price of the company is reacting to the gold correction, and the share price of the company is correcting from its recent high of A$5.010 (as on 5th July 2019).
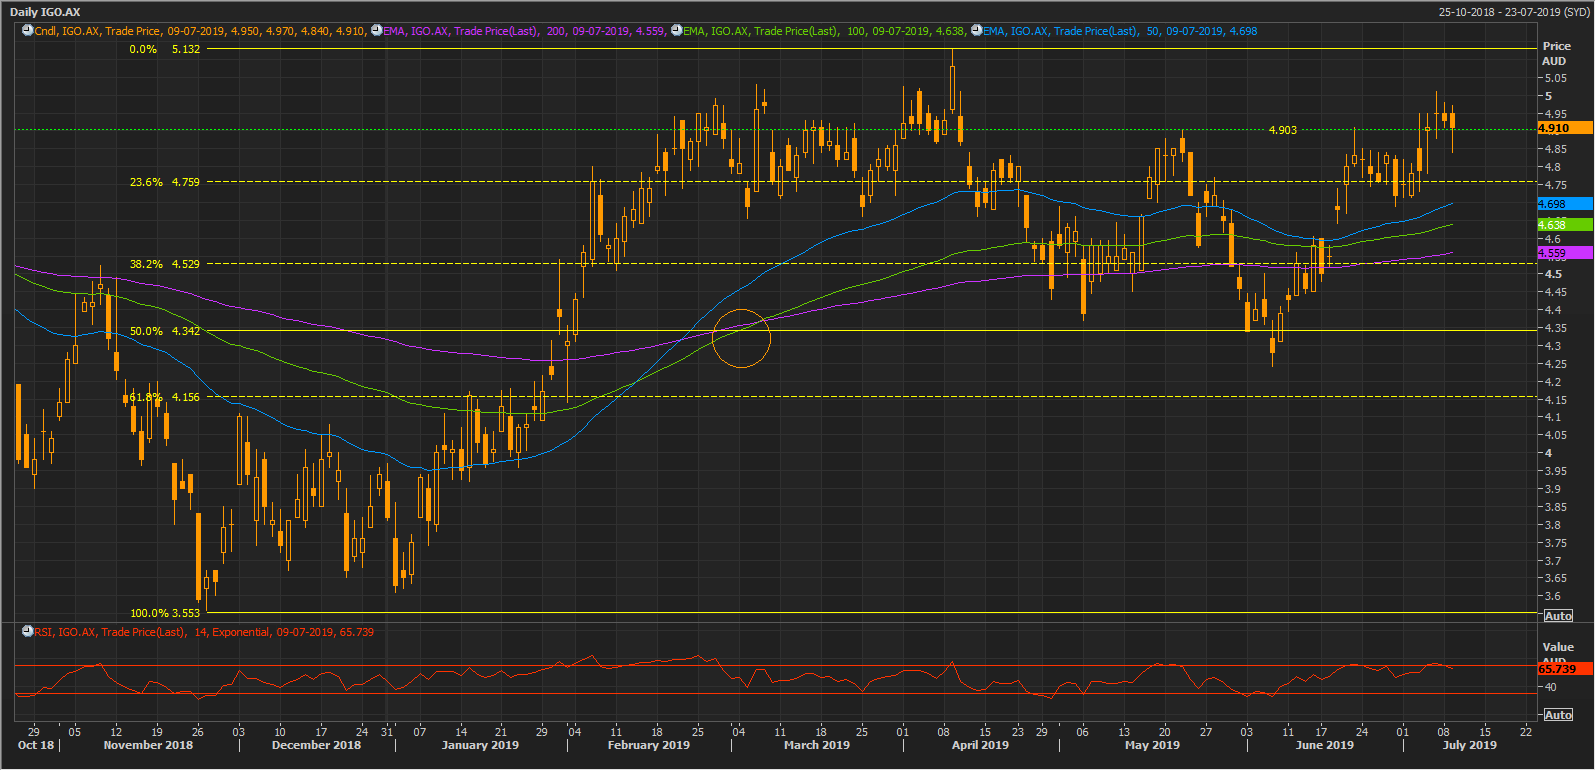
IGO Daily Chart (Source: Thomson Reuters)
On a daily chart, the share price corrected by more than 50.0 per cent of the initial upside rally, which started from the level of approx. A$3.553 to the level of approx. Post correcting the share price of the company rose again and crossed its primary hurdle at A$4.903, which is now acting as support.
Presently, the share price is trending above its 200,100, and 50-days exponential moving averages, which are at A$4.559, A$4.638, and A$4.698 respectively.
Investor should monitor the level of A$4.903 as a break below and sustain above the level would decide further price actions. If, the price breach the level of A$4.903, the trio of moving averages could act as the second support.
The gold miners generally move in tandem with the gold prices; however, being an equity, the shares of the company hold unsystematic risk, and those unsystematic risk could sometime weight more than the underlying asset.
Such a behaviour causes divergence in the share price actions as compared to the underlying asset. Let us now look at the miners moving opposite to gold.
Ausgold Limited (ASX: AUC)
The share price of the company is moving in opposite direction to gold, while gold is moving in an uptrend the share price of the company is trending lower and lower.
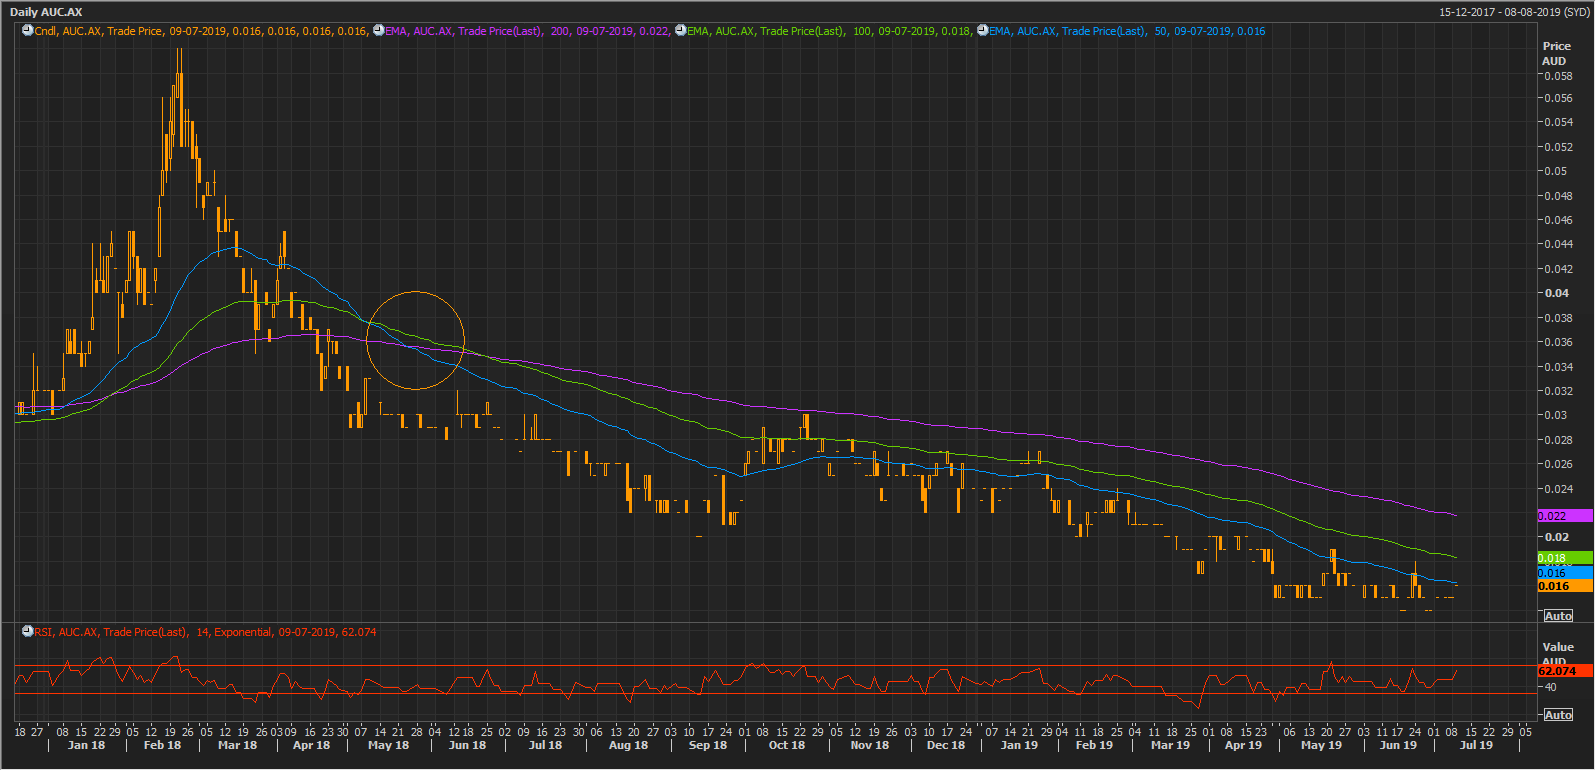
AUC Daily Chart (Source: Thomson Reuters)
Post marking a Death Cross (bearish signal), shown on the chart above, with an orange circle, the share price of the company moved in a downtrend. Presently, the share price is trading below its 200,100, and 50-day exponential moving averages, which are at A$0.022, A$0.018, A$0.016 respectively.
On a daily chart, the trio of the moving averages are offering resistance to the share price of the company. The cross above or sustain below the trio of moving averages would decide further price action.
Dacian Gold Limited (ASX: DCN)
The share price of the company is following the same trajectory, and recently, the share witnessed a large gap down.
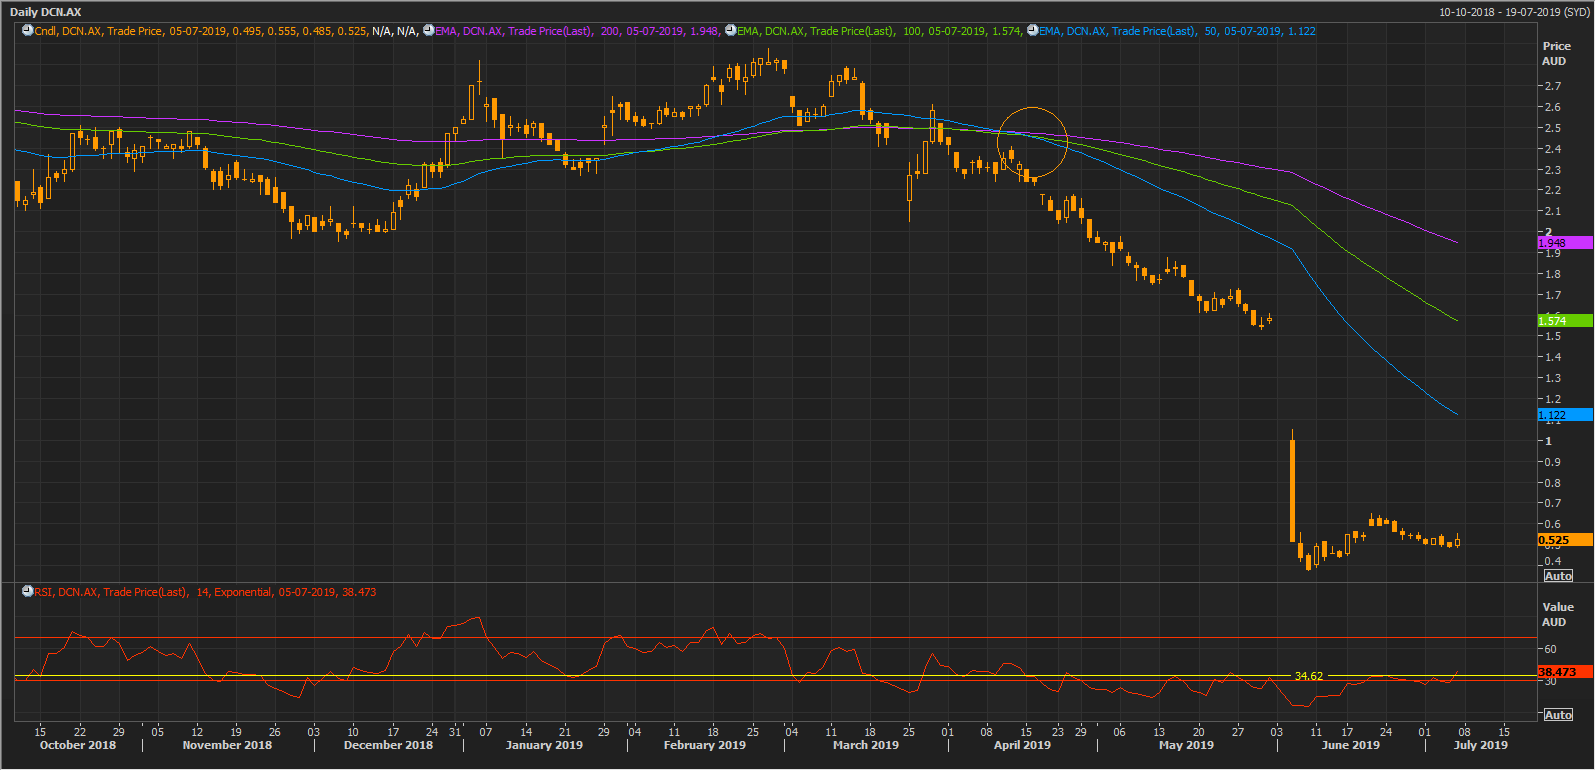
DCN Daily Chart (Source: Thomson Reuters)
The share price is currently trading below the trio of 200,100, and 50-day exponential moving averages, which are at A$1.948, A$1.574, and A$1.22 respectively. The trio could offer a substantial resistance to the share price of the company, and market participants should underpin these levels and trade the share carefully.
Intermin Resources Limited (ASX: IRC)
IRCâs shares are following the same footprints as above two gold miners, and the share price is moving in a downtrend.
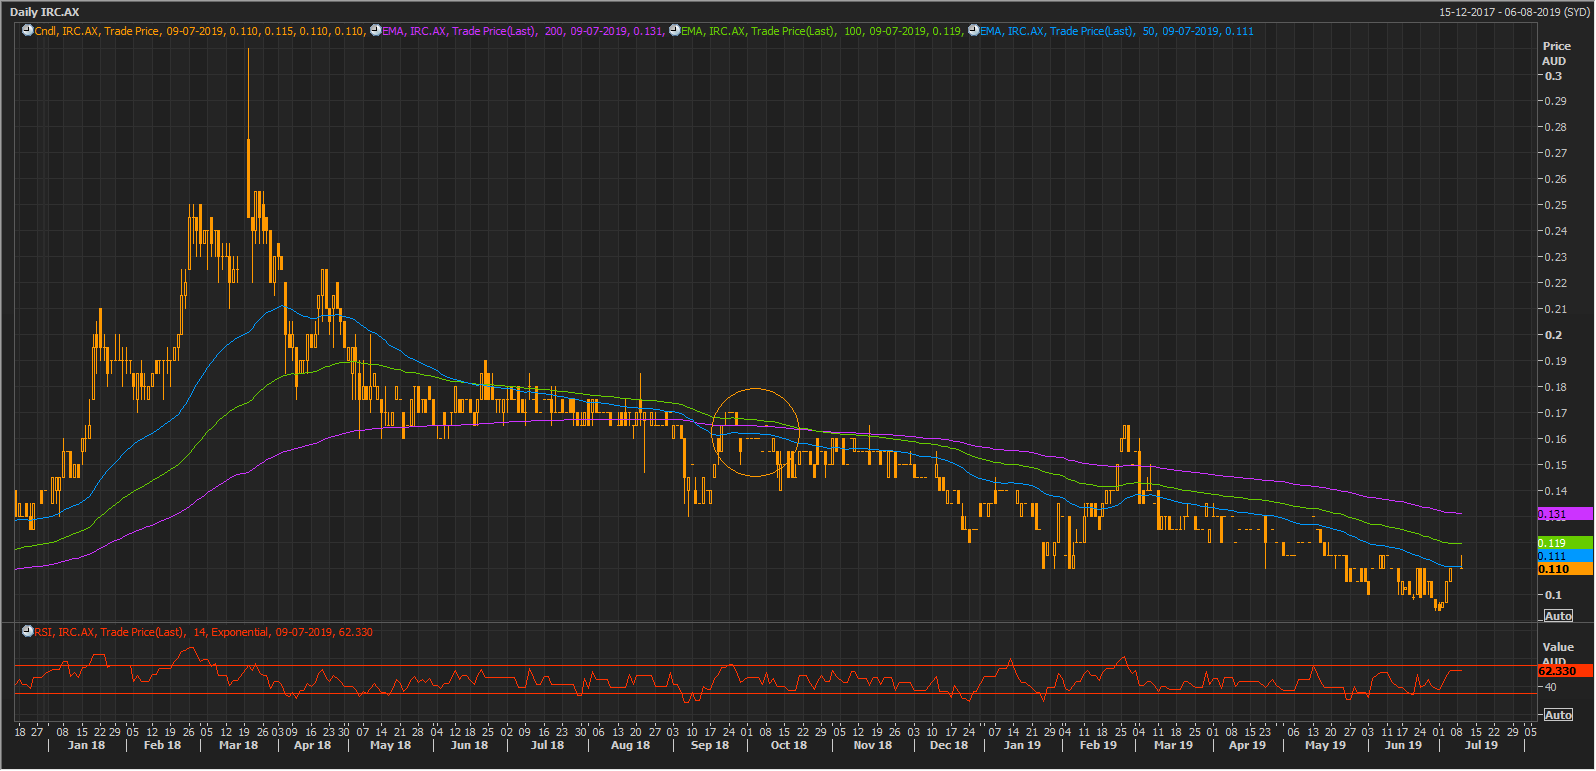
IRC Daily Chart (Source: Thomson Reuters)
The share is trading below the 200,100, and 50-day exponential moving average; however, the share tried to breach the short-term 50-day EMA but failed to close above it. The investors should keep a close eye around the level of A$0.119 as a break and sustain above or failure to do so would decide further price actions.
Carawine Resources Limited (ASX: CWX)
The shares of the company are moving in a downtrend for over a year, and the recent gold rush extended no support to the share price.
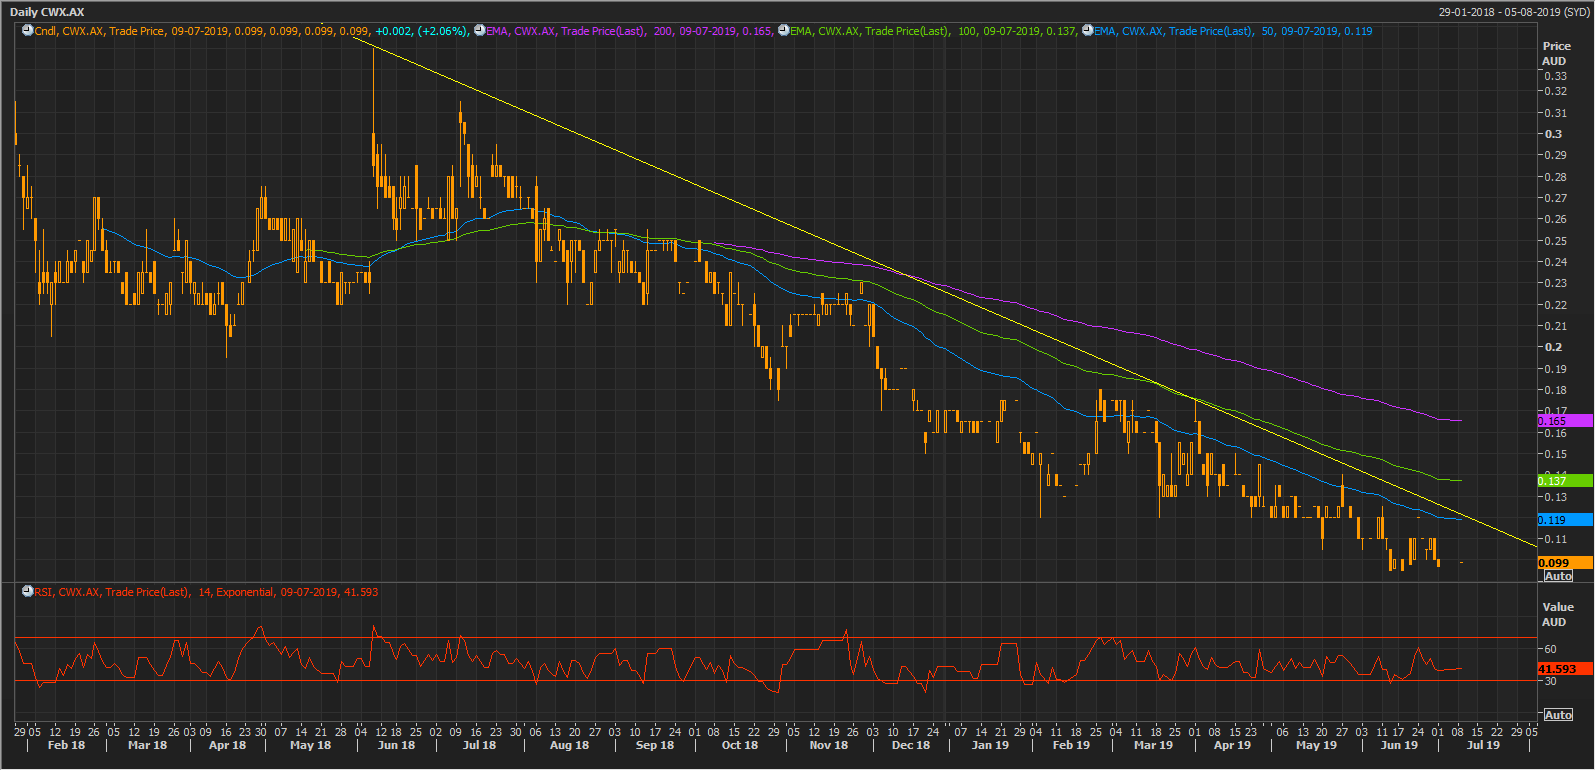
CWX Daily Chart (Source: Thomson Reuters)
On the daily chart, it can be seen that the share price of the company is moving below the downward sloping yellow trendline since the early June 2018. The share is trading below the trio of 200,100, and 50-day exponential moving averages.
Investors should keep a close eye around the level of A$0.119, as break above and sustain or failure to do so would decide further price actions.
More Junior Gold Miners:
Encounter Resources Limited (ASX: ENR)
The share price of the company witnessed a Golden Cross (bullish signal) 100 and 200-day exponential moving average and rose on the charts.
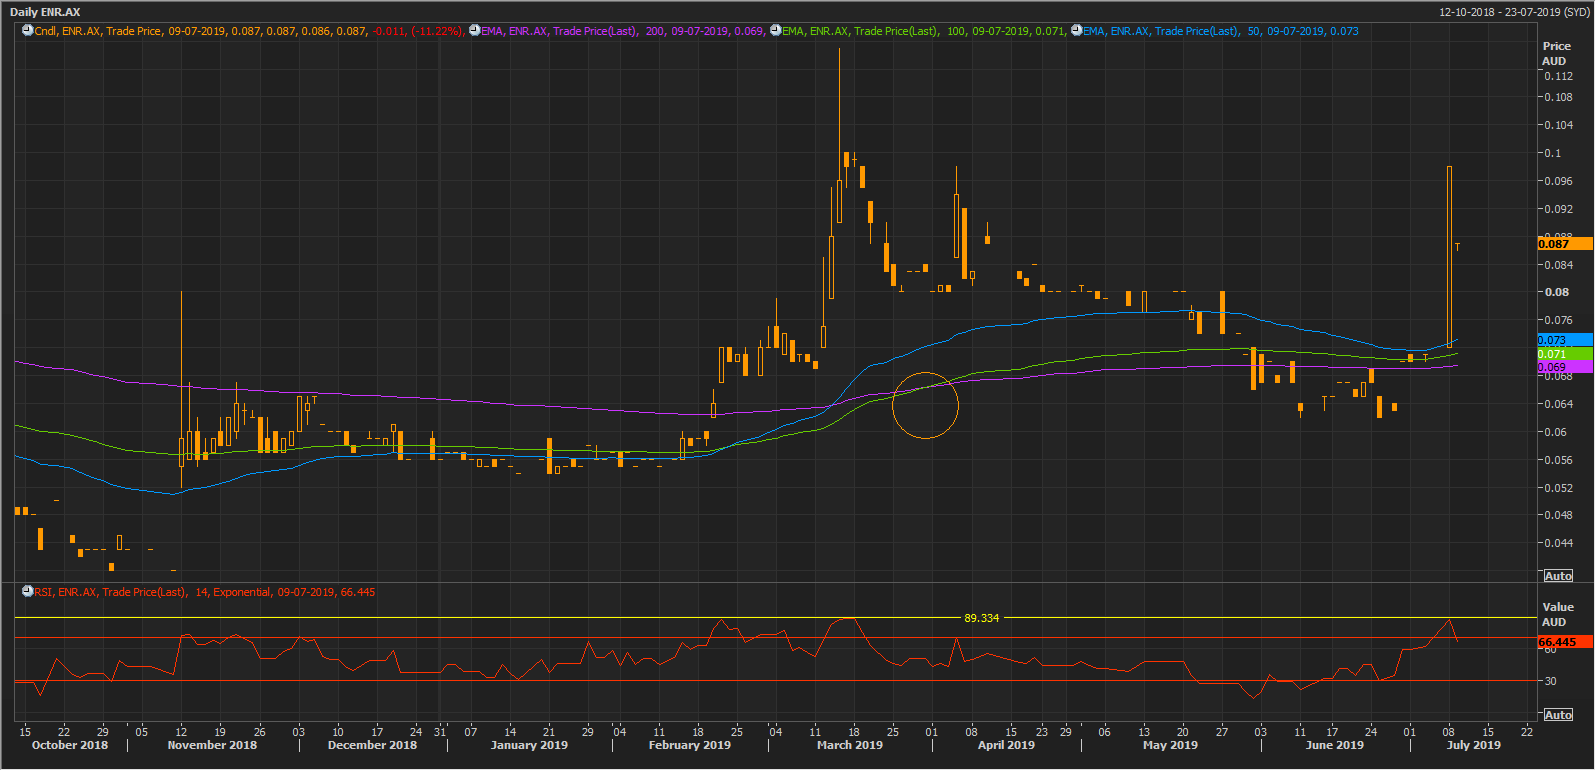
ENR Daily Chart (Source: Thomson Reuters)
On a daily chart, the share is trading above the trio of 200,100, and 50-days exponential moving averages, which are presently at A$0.069, A$0.071, and A$0.073 respectively.
The 14-day Relative Strength Index reached near its primary hurdle of 89.334 and retraced back as the share price witnessed a significant gap down opening post a substantial upside.
Tietto Minerals Limited (ASX: TIE)
The share price of the company is moving up, despite the retracement in gold.
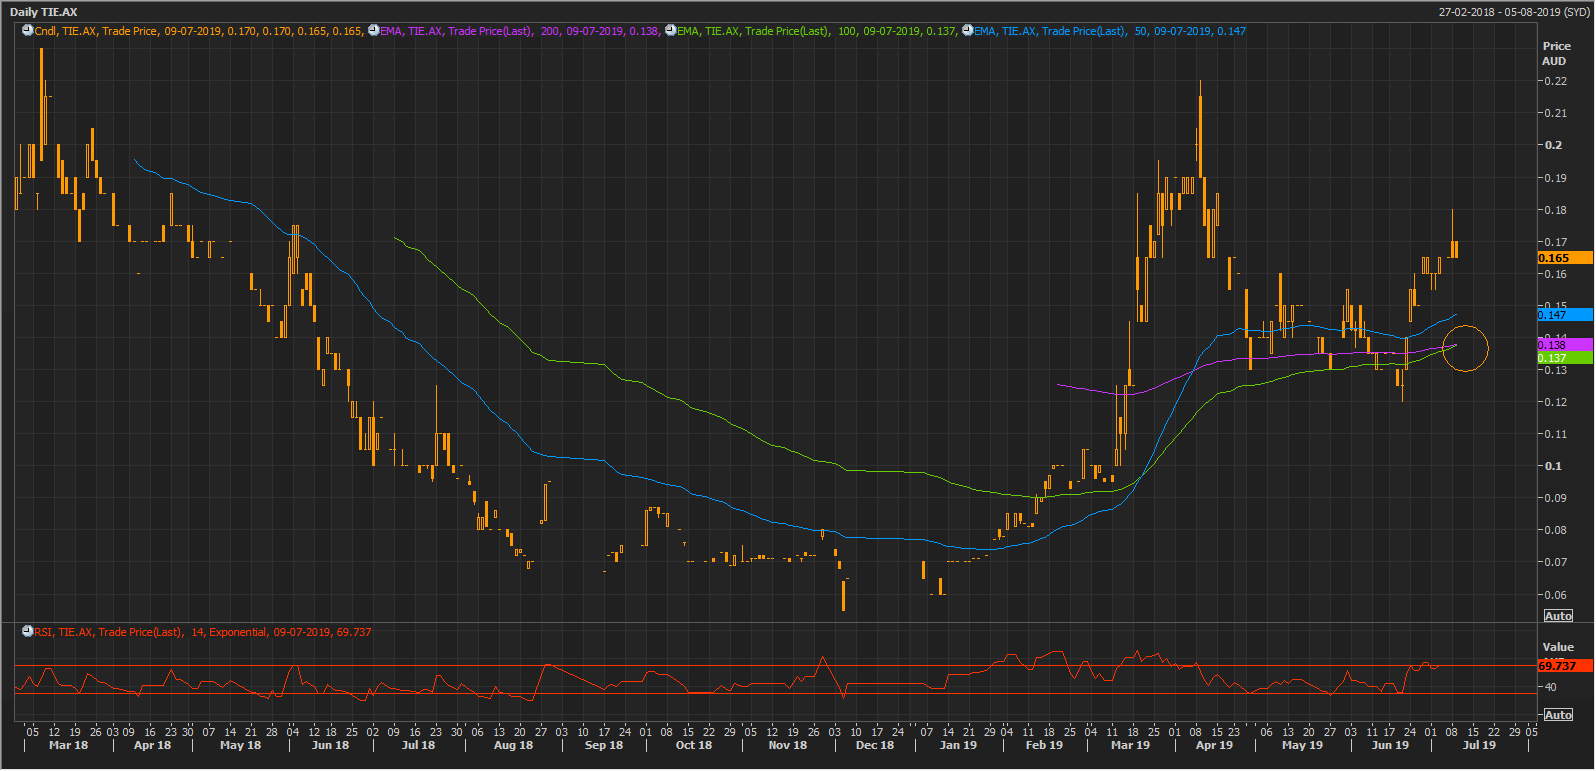
TIE Daily Chart (Source: Thomson Reuters)
On a daily chart, the share price actions are witnessing a formation of a Golden Cross (bullish signal), and the share is trading above the trio of 200,100, and 50-day exponential moving average, which are at A$0.138, A$0.137, and A$0.147 respectively.
Lefroy Exploration Limited (ASX: LEX)
LEX is trending upside from the second quarter of the year 2019.
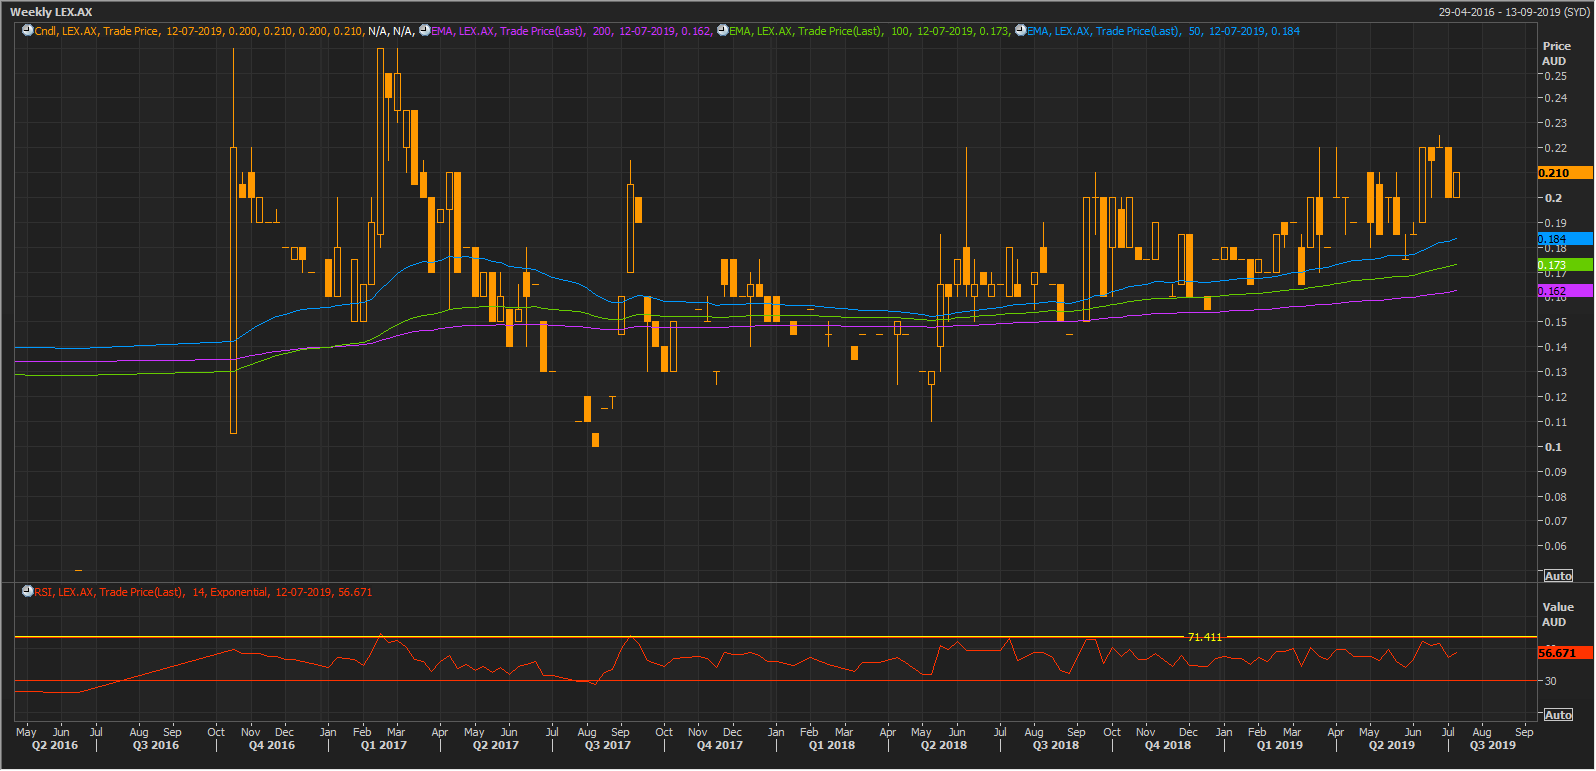
LEX Weekly Chart (Source: Thomson Reuters)
On a weekly chart, the share price is taking support at the 50-days exponential moving average, which is at A$0.184.
The trio of 200,100 and 50-day exponential moving average is trending near to each other, which in turn, suggests low volatility in the share price of LEX. The 14-day Relative Strength Index is currently taking the hurdle of 71.411.
Disclaimer
This website is a service of Kalkine Media Pty. Ltd. A.C.N. 629 651 672. The website has been prepared for informational purposes only and is not intended to be used as a complete source of information on any particular company. Kalkine Media does not in any way endorse or recommend individuals, products or services that may be discussed on this site. Our publications are NOT a solicitation or recommendation to buy, sell or hold. We are neither licensed nor qualified to provide investment advice.
