


Australia?s benchmark index, the S&P/ASX 200 delivered another disappointment on 21st November 2019, closing 0.7 per cent or 49.5 points down at 6672.9 points.
The All Ordinaries index also finished 0.7 per cent or 50.6 points lower at 6777.7 points. Moreover, all the industry sectors ended the trading session in red, with the Information Technology sector witnessing a maximum drop of 1.28 per cent.
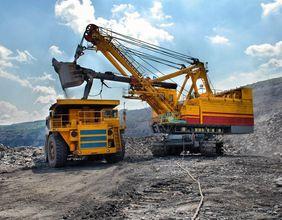
Equity markets in red territory
All the big four banks of Australia, including Commonwealth Bank of Australia (ASX: CBA), Westpac Banking Corporation (ASX: WBC), National Australia Bank Limited (ASX: NAB) and Australia and New Zealand Banking Group (ASX: ANZ) saw a fall in their stock prices.
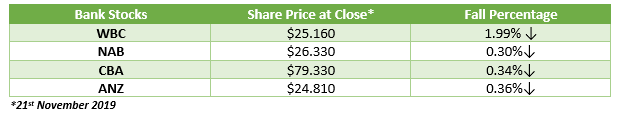
WBC observed the maximum fall of about 2 per cent on the speculation that the bank could be punched with the biggest fine in the country?s corporate history for breaching counter terrorism financing and anti-money laundering laws for about 23 million times.
The Australian share market took a cue from the US markets that slumped on Wednesday, with Dow Jones Industrial Average, S&P 500 Index and Nasdaq Composite plunging by 0.40 per cent, 0.38 per cent and 0.51 per cent, respectively.
The Wall Street?s main indexes fell significantly after a report that signalled that the US-China ?phase one? trade deal may not be completed this year.
The report mentioned that the trade deal completion could slide into next year as the US President, Donald Trump?s administration counters with his own heightened demands and Beijing presses for more massive tariff rollbacks.
Some market experts are also advising to relax over the prospects of the US-China trade deal.
US-China Phase One Deal
The two largest economies of the world- China and the US decided last month to enter into a phase one deal this year, under which Beijing would buy USD 40 billion ? USD 50 billion worth of American agricultural products, in exchange for a halt on the US? scheduled October 15 tariff rise. Though, the option to increase tariff on December 15 was left open.
The phase one deal involves the roll back of existing additional tariffs by both sides (China and the US) in the same proportion.
News are doing rounds that the Trump administration has decided to roll back the current tariffs, along with cancelling the planned tariff hike on some $156 billion of Chinese consumer goods on December 15, if he could get commitments from China on agricultural purchases and intellectual property transfers.
The Trump administration seems unwilling to roll back tariffs for a deal that doesn?t tackle technology transfer and intellectual property issues. Trump has warned to levy higher tariffs if China does not agree to make a trade deal.
?As per market experts, the US President wants to have a wider deal with China than this little one.
Bill Supporting Hong Kong Protestors Could Hamper Trade Deal
The bill that compels the US to support pro-democracy activists in Hong Kong has won House and Senate approval, putting pressure on Trump administration to sign the bill into law. Market experts believe that the bill could potentially complicate the talks between the US and China to end the trade war.
The bill requires the US government to levy sanctions on Chinese officials that are responsible for human rights abuses in the territory, abolishing Hong Kong?s special status. China has condemned the passage of the bill and has threatened of strong countermeasures to safeguard its security and sovereignty.
As per China's foreign ministry, the bill, if passed, would harm China-US relations and Chinese interests, along with the US's own interests.
How US-China Trade Debacle is Affecting Both Sides?
The recent updates on the following indicators demonstrate that the uncertainty over the international trade policy has significantly affected both the US and Chinese markets:
US Industrial Production
The industrial production of the US dropped 0.8 per cent in October, against the expectation of 0.4 per cent fall. Manufacturing production also fell 0.6 per cent mostly due to a decline in the output of motor vehicles and parts of 7.1 per cent that stemmed from a strike at a major motor vehicle manufacturer.
The decreases for total manufacturing, motor vehicles and parts and industrial production were largest since January 2019, April 2019 and May 2018, respectively.
China Industrial Production
China?s industrial production increased slower than projected in October by 4.7 per cent, against the expectation of 5.5 per cent rise. The increase was also substantially lower than September?s rise of 5.8 per cent.
The market experts opined that China?s economic woes were due to relatively greater external uncertainties and the slowdown in global economic growth.
Moreover, there were some indicators that showed an improvement in the countries? conditions, that are discussed below:
Inflation
The US consumer prices jumped 2.3 per cent in October after rising 2.4 per cent in September, signalling that Fed would not go for further interest rate cuts in the near future. Over the 12 months to October, the CPI improved 1.8 per cent after soaring 1.7 per cent in September.
The increase in CPI was significantly greater than the expected month-on-month increase of 0.3 per cent and the year-on-year increase of 1.7 per cent.
China?s consumer inflation also rose 3.8 per cent in October from a year earlier, observing the highest annual increase since January 2012. The increase was greater than the forecasted rate of 3.4 per cent.
Manufacturing PMI
The Caixin China manufacturing PMI (Purchasing Managers Index) increased to 51.7 in October because of renewed strength in the country?s exports. The country saw its 32-month high increase, owing to talks over phase one deal with the US that eased the trade tensions during the month.
The IHS Markit Manufacturing PMI in the US also improved to 51.3 in October in seasonally adjusted terms, observing its highest level in six months. The expansion was supported by faster expansions in new businesses and output.
US Producer Price Index
The producer prices in the US rose 0.4 per cent in October, after falling 0.3 per cent in September. This was the biggest such increase seen by the country since April 2019.
Over the year to October, the PPI climbed 1.1 per cent after advancing 1.4 per cent in September. Economists had forecasted a month-on-month growth of 0.3 per cent and year-on-year growth of 0.9 per cent in October.
One can infer that the challenging economic conditions in the international market continue to create uncertainty over the signing of phase one trade deal and the performance of indicators in the coming months.
Disclaimer
This website is a service of Kalkine Media Pty. Ltd. A.C.N. 629 651 672. The website has been prepared for informational purposes only and is not intended to be used as a complete source of information on any particular company. Kalkine Media does not in any way endorse or recommend individuals, products or services that may be discussed on this site. Our publications are NOT a solicitation or recommendation to buy, sell or hold. We are neither licensed nor qualified to provide investment advice.
