


Highlights:
- Definition of Net Change – Net change refers to the difference between the last trade price of a security or asset at the end of the current trading session and its last trade price from the previous session.
- Significance in Market Analysis – It is a key indicator used by traders and investors to assess daily price movements and overall market trends.
- Applications in Trading and Investing – Net change helps in evaluating stock performance, tracking market sentiment, and making informed investment decisions.
Introduction
In the fast-paced world of financial markets, investors and traders rely on various indicators to assess price movements and market trends. One such fundamental metric is Net Change, which measures the difference between a security’s last traded price at the close of the current trading session and the last traded price from the previous session.
This seemingly simple concept plays a crucial role in understanding market fluctuations, tracking performance, and making strategic investment decisions. In this article, we will explore the significance of net change, its calculation, and its impact on trading and investing.
What is Net Change?
Net change represents the absolute difference between the closing price of an asset today and its closing price from the previous trading day. It is commonly expressed in two ways:
- As a numerical value (e.g., +$2.50 or -$1.75)
- As a percentage (e.g., +3.2% or -1.8%)
Formula for Net Change
Net Change=Current Closing Price−Previous Closing Price\text{Net Change} = \text{Current Closing Price} - \text{Previous Closing Price}Net Change=Current Closing Price−Previous Closing Price
For example, if a stock closed at $150 today and its previous closing price was $145, the net change would be:
150−145=+5.00150 - 145 = +5.00150−145=+5.00
This means the stock gained $5.00 compared to the previous session.
Why is Net Change Important?
- Measuring Daily Market Performance
Net change provides a direct snapshot of how a stock, index, or commodity performed on a given trading day. Positive net change indicates a price increase, whereas negative net change suggests a decline.
- Tracking Market Sentiment
Investors analyze net change to gauge overall market sentiment. For instance:
- If multiple stocks in a sector show positive net change, it may indicate bullish sentiment.
- If major indices, such as the S&P 500 or Dow Jones Industrial Average, experience negative net change, it may signal bearish conditions.
- Identifying Volatility and Trends
Large fluctuations in net change highlight periods of high volatility, while consistent increases or decreases over time may indicate an emerging trend.
How Net Change is Used in Trading and Investing
- Stock Market Analysis
Net change is one of the first metrics traders examine when assessing daily stock movements. It helps in:
- Identifying winners and losers of the day
- Understanding sector performance
- Comparing individual stock movements against market indices
- Technical Analysis and Charting
Many traders use net change alongside candlestick charts, moving averages, and trend lines to make informed trading decisions. Large price swings in net change can indicate breakout or reversal signals in technical analysis.
- Impact on Portfolio Management
Investors use net change to:
- Monitor daily fluctuations in their holdings
- Make adjustments to diversify or rebalance portfolios
- React to market news or economic events affecting asset values
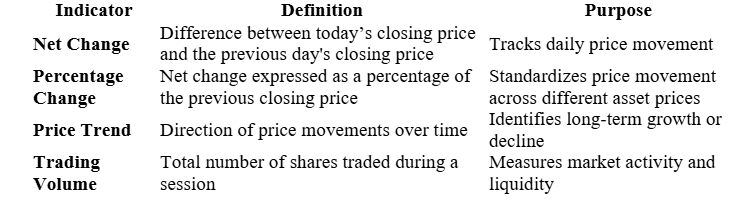
Net Change vs. Other Market Indicators
Factors That Influence Net Change
Several factors contribute to fluctuations in net change, including:
- Market News and Earnings Reports
Company-specific news, earnings releases, or management announcements can cause sharp price changes. Positive news typically leads to higher net change, while negative news can result in a drop in stock value.
- Macroeconomic Events
Economic indicators such as interest rate changes, inflation data, and GDP growth affect overall market sentiment, influencing net change across multiple stocks or indices.
- Supply and Demand Dynamics
Stock prices are influenced by supply and demand. A high demand for a stock drives prices up, resulting in a positive net change, while a selling spree can lead to a negative net change.
- Market Sentiment and Investor Psychology
Emotional factors such as fear, greed, or speculation can cause large swings in net change, especially during uncertain market conditions.
Examples of Net Change in Action
Example 1: A Bullish Day for a Stock
Suppose Company ABC’s stock closed at $100 yesterday. Today, after a positive earnings report, the stock closes at $110.
- Net Change = $110 - $100 = +10.00
- This indicates that the stock gained $10 in value, signaling strong investor confidence.
Example 2: Market-Wide Sell-Off
The Dow Jones Industrial Average closed at 35,000 the previous day but dropped to 34,600 due to recession fears.
- Net Change = 34,600 - 35,000 = -400
- This reflects a 400-point loss, signaling a bearish market reaction.
Limitations of Net Change
While net change is a useful metric, it has some limitations:
- Lacks context on percentage impact – A $5 change is significant for a $50 stock but minor for a $1,000 stock.
- Does not account for intraday fluctuations – It only reflects closing prices, ignoring price movements during the trading session.
- Can be misleading during low-volume trading – Stocks with low liquidity can show sharp net changes without real market strength.
Conclusion
Net change is a fundamental yet powerful metric in financial markets, providing insights into daily stock performance, market sentiment, and investor behavior. Whether used by traders for short-term analysis or investors for portfolio management, it remains a key indicator in understanding price movements. However, to make well-informed financial decisions, it is best used in conjunction with other market indicators such as percentage change, trading volume, and technical analysis tools.
