


_10_04_2024_16_38_50_427275.jpg)

Copper as an asset
Copper is considered to be an important commodity, primarily because of the various uses the metal has in different industries. The Infrastructure Industry, in particular, is very much dependent on copper, and hence, whenever there is a phase of infrastructure growth, majorly from the developing countries, the demand of copper always increases.
Copper is traded on various commodity and metal exchanges across the world such, as the London Metal Exchange (LME) and Multi Commodity Exchange (MCX) of India, where investors can trade copper on spot prices as well as trade future and forward contracts, as hedging tool for the industrial purposes as well as for the purpose of speculation.
The demand for copper as an asset is expected to increase across the world, primarily due to the advent and rapid increase in the Electric Vehicle market, because of the batteries used by them, as copper remains an important raw material for battery manufacturing. Since China is one of the largest battery markets in the world, the copper demand in China stays very high. On the same time, Chile is one of the biggest hubs in the world for Copper Production as some of the biggest copper mines in the world are located in the country. This was also the reason that the supply of the copper across the world was deeply impacted in 2019, when civil unrest in the country of Chile led to a drop in production of the commodity during the year, which, combined with higher demand, steered the sharp rise in copper prices in the year.
The recent signing of the phase 1 trade agreement between US and China saw a massive increase in the prices of commodities, yet, a lot of uncertainty has stayed in terms of the result of the trade deal. Copper prices reached its 8-month peak during the week gone by, which gave the investors an opportunity for speculation.
Factors Affecting the price of Copper
Prices of copper are primarily affected by the demand and the supply of the product across various industries, as mentioned above. While demand is primarily based on the consumption of the product, supply of copper, which is further affected by factors such as government tax rates and regulations around mining, interest rates. These all factors impact the cost of borrowing for the purpose of obtaining capital, as well as the price of alternative base metals such as aluminium, nickel, lead and iron.
London Copper Prices at a Two Week Low
On 21st January 2020, the Benchmark three-month copper prices on the London Metal Exchange dropped by 0.5 per cent to US $6,128 per tonne, the lowest price in the last two weeks, since 08th January 2020, but the prices later recovered to US $6,160 per tonne. The Benchmark three-month copper contract had dropped 1.6 per cent in the previous session, the largest single-day loss that the commodity had suffered since 31st October 2019.
The copper contract with the largest volume traded on the Shanghai Futures Exchange was down to 48,280 Yuan (US $6,995.07) per tonne, the lowest it had been since 9th December 2019, before rebounding a little to 48,480 Yuan per tonne later during the day.
Experts suggested that this was due to the news of Wuhan Coronavirus crisis in China, because China is one of the largest Copper markets in the world. Concerns of the spread of the flu-like virus, which can be passed between humans impacted the sentiments, as around nine deaths had been reported so far, while there were 440 confirmed cases, just ahead of the start of travel season for the Lunar New Year. Since the fear of this Virus was rising, the World Health Organisation (WHO) has been reviewing the entire situation, one case was confirmed in the United States of America, while travellers in the entire world, especially in Asia remain worried.
Keeping in view the latest development, we are going to discuss here the stock price performance of some key FTSE stocks that into the copper business, which are most likely to be impacted by the situation
GLEN Share Price Performance
On 22nd January 2020, at around 08:30 A.M (Greenwich Mean Time), at the time when this report was being written, Glencore Plcâs share price was reportedly at GBX 238.45 per share on the London Stock Exchange market, a jump in the price of 0.19 per cent or GBX 0.45 per share, as opposed to the last trading dayâs closing price, that was reportedly at GBX 238.00 per share.
The market capitalisation of Glencore Plc was reported to be at £31.711 billion with regards, to the price at which the companyâs share was trading at the time of writing.
The companyâs share has depicted a negative change of around 17.76 per cent, in the year gone by, from the price of GBX 289.95, at which the companyâs share was trading as on January 22, 2019. The companyâs share has also given a negative return of around 12.43 per cent, in last one monthâs time from the share price of GBX 272.30 per share that the share achieved at the close of the market on December 22, 2019. The companyâs stock beta was reported at a value of 2.10.
KAZ Share Price Performance
On 22nd January 2020, at around 08:35 A.M (Greenwich Mean Time), at the time when this report was being written, KAZ Minerals Plcâs share price was reportedly at GBX 535.00 per share on the London Stock Exchange market, a decline in the price of 0.45 per cent or GBX 2.40 per share, as opposed to the last trading dayâs closing price, that was reportedly at GBX 537.40 per share.
The market capitalisation of KAZ Minerals Plc was reported to be at £2.538 billion with regards, to the price at which the companyâs share was trading at the time of writing.
The companyâs share has depicted a positive change of around 2.49 per cent, in the year gone by, from the price of GBX 522.00, at which the companyâs share was trading as on January 22, 2019. The companyâs share has also given a negative return of around 7.89 per cent, in last one monthâs time from the share price of GBX 580.80 per share that the share achieved at the close of the market on December 22, 2019. The companyâs stock beta was reported at a value of 2.63.
AAZ Share Price Performance
On 22nd January 2020, at around 08:40 A.M (Greenwich Mean Time), at the time when this report was being written, Anglo Asian Mining Plcâs share price was reportedly at GBX 142.60 per share on the London Stock Exchange market, a drop in the price of 0.63 per cent or GBX 0.90 per share, as opposed to the last trading dayâs closing price, that was reportedly at GBX 143.50 per share.
The market capitalisation of Anglo Asian Mining Plc was reported to be at £164.15 million with regards, to the price at which the companyâs share was trading at the time of writing.
The companyâs share has depicted a positive change of around 82.12 per cent, in the year gone by, from the price of GBX 78.30, at which the companyâs share was trading as on January 22, 2019. The companyâs share has also given a positive return of around 11.84 per cent, in last one monthâs time from the share price of GBX 127.50 per share that the share achieved at the close of the market on December 22, 2019. The companyâs stock beta was reported at a value of -0.14.
BZT Share Price Performance
On 22nd January 2020, at around 08:45 A.M Greenwich Mean Time, at the time when this was being written, Bezant Resources Plcâs share price was reportedly at GBX 0.208 per share on the London Stock Exchange market, a jump in the price of 4.00 per cent or GBX 0.008 per share, as opposed to the last trading dayâs closing price, that was reportedly at GBX 0.20 per share.
The market capitalisation of Bezant Resources Plc was reported to be at £2.48 million with regards, to the price at which the companyâs share was trading at the time of writing.
The companyâs share has depicted a positive change of around 22.35 per cent, in the year gone by, from the price of GBX 0.17, at which the companyâs share was trading as on January 22, 2019. The companyâs share has also given a positive return of around 131.11 per cent, in last one monthâs time from the share price of GBX 0.09 per share that the share achieved at the close of the market on December 22, 2019. The companyâs stock beta was reported at a value of 0.46.
Comparative share price chart of GLEN, KAZ, AAZ and BZT
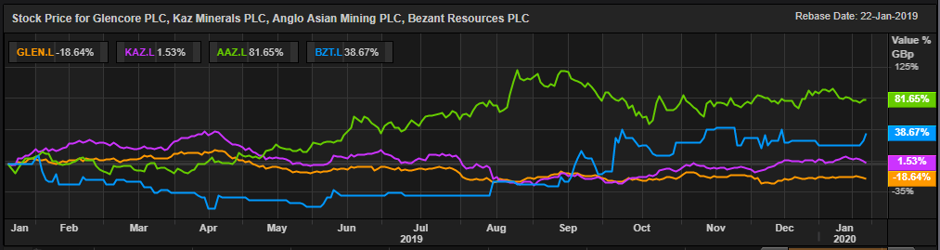
(Source: Thomson Reuters) Daily Chart as on 22-January-20, before the closing of the LSE Market
