


Summary
- S&P 500 has quadrupled in value since 2009 while the FTSE 100 has only doubled
- Technology businesses such as Apple Inc, Microsoft, Alphabet, and others represent 35 per cent of the S&P 500 index and has been supporting the rise
- Footsie valuation is closely related to foreign currency movements and gets impacted with fluctuation in the currency
Since the recovery started in the equity markets, all eyes have been focused on the US stock markets, which have been on a bull run, leaving behind the Covid-19 impact concern. The American indices like S&P 500 surged ahead of their counterparts in the UK and other regions around the world. The S&P 500 (SPX), America’s main stock index has risen by more than 50 per cent since the markets crashed in March, while the London’s broader equity benchmark index, FTSE 100 has only risen by around 21 per cent. In the past five years, the S&P 500 as risen by 72.78 per cent and has consistently outperformed the FTSE 100.

S&P 500 vs FTSE 100, 10-Year Comparative chart (Source: EODHD/Others, Thomson Reuters)
The S&P 500 has quadrupled in value since 2009, while the FTSE 100 has only doubled. On a YTD basis, the S&P 500 rose by more than 8 per cent, while the FTSE 100 plummeted by nearly 20 per cent.
Composition of indices
Footsie or FTSE 100 index is majorly constituted by oil, resource, and financial stocks. The price of the oil in recent times has gone down substantially due to the indirect impact of the coronavirus pandemic and the tussle among the oil-producing nations. FTSE 100 includes some of the bigger oil giants such as BP Plc (LON: BP.) and Royal Dutch Shell Plc (LON: RDSA), constituting the major portion of the index. These companies are also under immense pressure from the environmental activists and the government on reducing carbon emissions. The Oil & Gas businesses make up 11 per cent of the index.
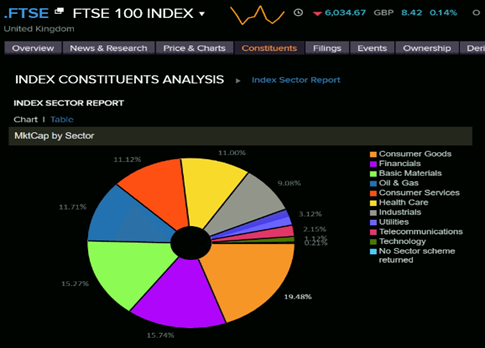
(Source: EODHD/Others, Thomson Reuters)
S&P 500 constituents
In the US stock markets, oil, and resource businesses make up a much smaller portion of the S&P 500; it is instead dominated by the technology giants. Technology businesses such as Apple Inc, Microsoft, Alphabet, and others make up 35 per cent of the S&P 500 index.
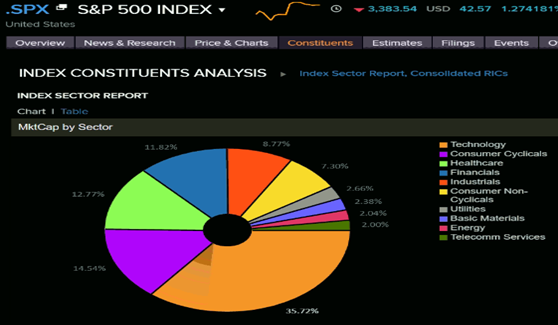
(Source: EODHD/Others, Thomson Reuters)
So if we compare the two, the technology sector makes up about just two to three per cent of the FTSE 100 index and is dominated by the resource and financial companies.
Factors which gave an edge to S&P 500 over FTSE 100
The S&P 500 or SPX is much more diversified both geographically and sectorally in comparison to London’s broader equity benchmark index. With 500 largest US based companies in comparison to just 100 companies in Footsie, there is certainly a lot more going on the American index.
However, both indices have their own pros and cons. Footsie has a lot of exposure to banking and financial services companies, and the S&P has a lot of exposure to technology companies. Throughout all major crisis that the world has seen (including the current one), technology has always been in demand and the S&P 500 has been able to capitalise on technological advancement. While the FTSE 100 index did not witness much growth as it was dominated by the conventional businesses.
In terms of size, there is absolutely no competition. The combined market value of S&P 500 is US$ 27.98 trillion, while the FTSE 100 has a market value of around £1.53 trillion. US based businesses gain better leverage in negotiation with other countries, and they get a better access to preferential treatment in international markets. In addition, the currency of US, “United States Dollar” is one of the most stable currencies across the globe.
If we talk about FTSE 100, it has a relatively high yield of 3.84 per cent in comparison to the S&P 500, which has a yield of 2.18 per cent. A big reason for this is that American technology companies prefer to reinvest the potential dividend pay-outs in research & development or acquisitions. Alternatively, FTSE 100 might offer some better buying opportunity for the high yield, but the S&P 500 is looked upon by investors looking for greater overall returns. Investors in UK stocks need higher dividends as compensation for the lower share price growth, whereas US stock markets have been compensating investors with incredible stock price growth regardless of the dividends.
Do read: Comparative Performance Analysis of FTSE 100 vs S&P 500 In February 2020
Why FTSE 100 has declined in recent times?
A few weeks ago, the US Fed announced to keep interest rates low, which was a major factor for UK stock markets. A lot of money has flown into US stock markets from across the world. However, the dollar has weakened. The weakening of dollar has a direct impact on the Footsie.
Most of the FTSE 100 listed companies have an international presence and are not really UK based. These companies have a significant amount of earnings in foreign currencies such as dollar. A large proportion of their profits are made in Dollars. Now if the sterling strengthens, the conversion of dollar earnings is worth far less. Therefore, we often see pound rising while Footsie falls. This implies that the Footsie valuation is closely related to foreign currency movements.
From an investor’s point of view, a portfolio should be well diversified. Both these indices provide ample opportunities for diversification. Investors could also consider some exposure to foreign markets. Technology stocks have a low weightage in the Footsie index, which is the driving force behind the success of the US stock markets. Brexit uncertainties seem to be another area of concern for businesses in the UK.
