


Highlights
- I3 Energy PLC (LSE:I3E) is an FTSE AIM UK 50 Index listed independent oil and gas development company with a growing full-cycle energy business.
- During FY22, I3E secured ~140.1% YoY growth in total revenue and over 67% YoY increase in profit after tax.
- For FY23, the company expects to increase its total dividend amount to be paid to £24.5 million from £17.4 million in FY22.
I3 Energy PLC (LSE:I3E) is an FTSE AIM UK 50 Index listed independent oil and gas development company with a growing full-cycle energy business. It hosts a suite of assets in the UK North Sea (UKNS) and the Western Canadian Sedimentary Basin (WCSB), while operations are based in the United Kingdom. The Liberator oil field constitutes the core asset of the firm.
I3E is concentrating on acquiring, developing, and producing high-return resources. It has a mission to return value to shareholders through the deployment of its growth model, by way of growth-related share price appreciation, monthly dividend distributions, and opportunistic share buybacks.
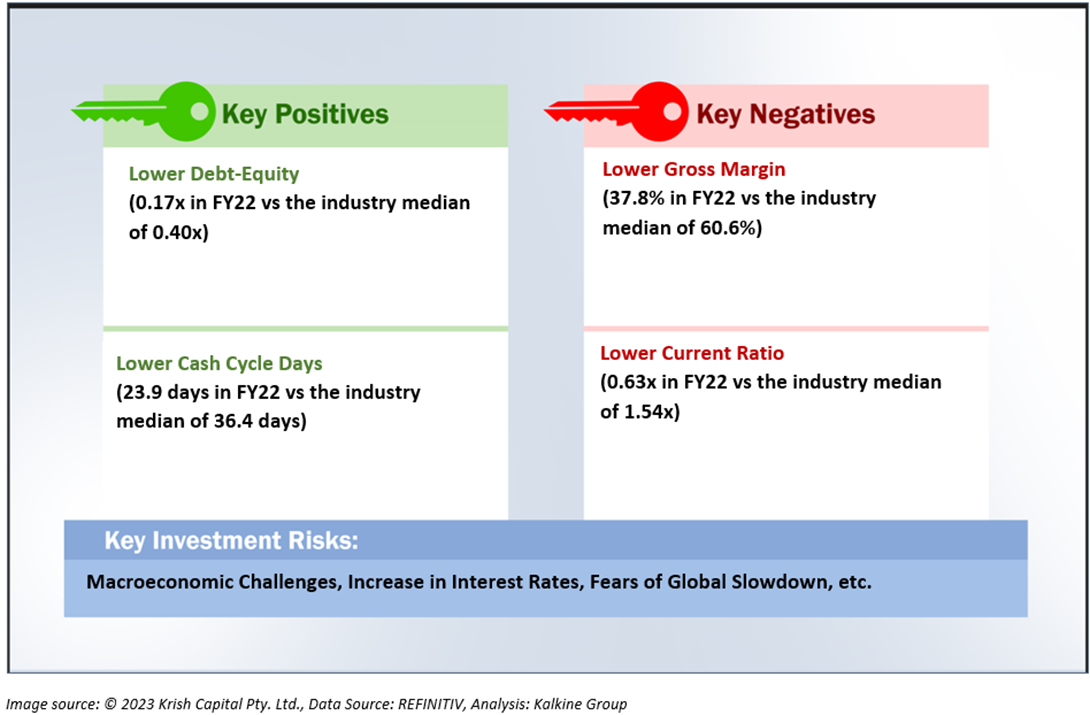
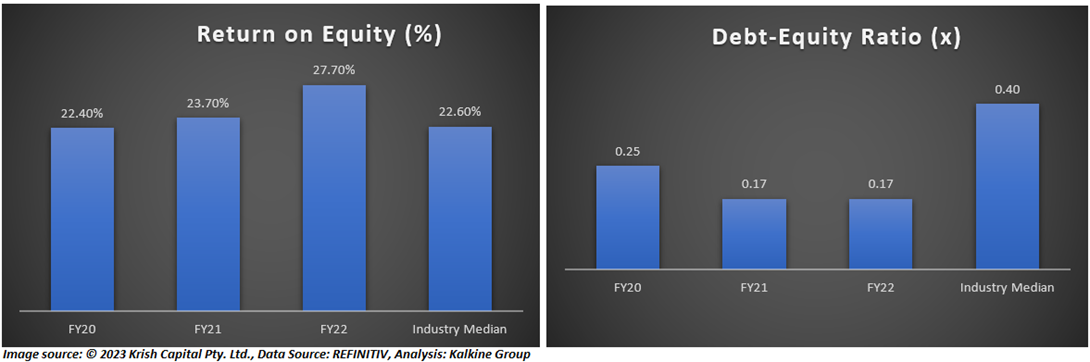
I3E Fiscal Metrics
In FY22, I3 Energy achieved more than 140% year-on-year (YoY) increase in total revenue and around 67.3% YoY growth in profit after tax. For the ongoing fiscal year FY23, the company is expecting a dividend increase to £24.5 million from £17.4 million in FY22.
The company has forecasted annual average production of 22,250 - 23,000 boepd (barrels of oil equivalent per day) for FY23, illustrating an YoY growth of approximately 10% - 13% when compared to FY22 levels.
Top 10 Shareholders
The top 10 shareholders collectively form ~59.21% of the total shareholdings. Polus Capital Management Ltd. holds the maximum number of shares with ~19.50% shareholding, followed by Premier Asset Management Ltd with ~9.92% shareholding, as depicted in the chart below.

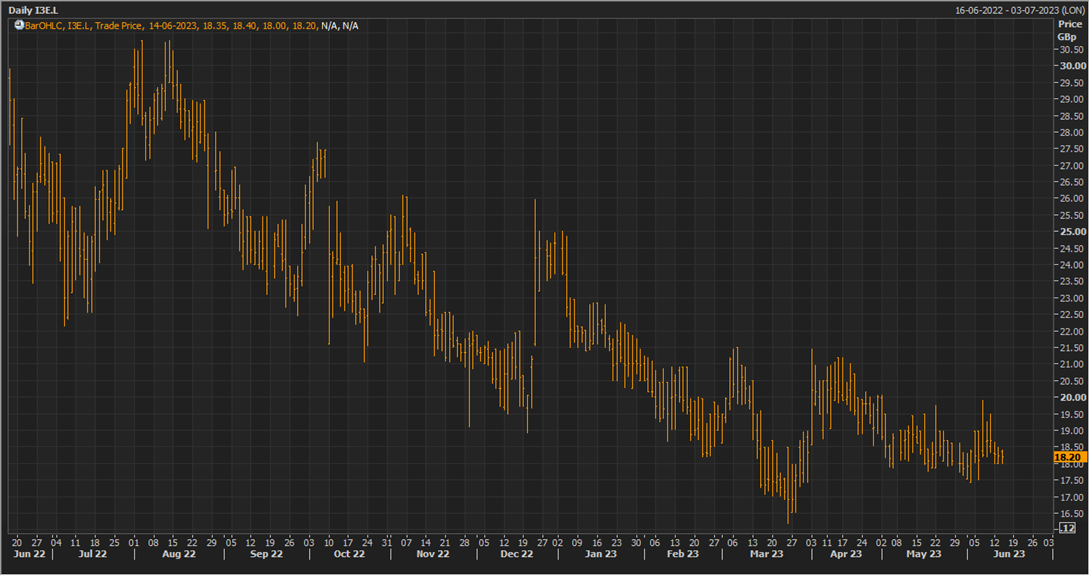
Stock Price Performance
The stock has witnessed a decline of ~1.83% in the last one month and over the last 6 months, it has decreased by ~14.98%. The stock has a 52-week low and 52-week high of GBX 16.20 & GBX 31.60, respectively and is currently trading below the average of 52-week high-low.
Data Source: EODHD/Others, Analysis done by Kalkine Group
Note 1: Past performance is not a reliable indicator of future performance.
Note 2: The reference data for all price data, currency, technical indicators, support, and resistance levels is 15 June 2023. The reference data in this report has been partly sourced from EODHD/Others.
