


Highlights
- Woodside Energy Group Ltd (LSE:WDS) is an LSE-listed Australian petroleum exploration and production company.
- The company is ranked amongst the top ten global independent energy company by hydrocarbon production.
- During Q1 FY23, the company secured a revenue of about US$4,330 million, marking an increase of over 81% on pcp.
An LSE-listed Australian petroleum exploration and production company, Woodside Energy Group Ltd (LSE:WDS) is ranked amongst the top ten global independent energy players in terms of hydrocarbon production.
During the first quarter of FY23, the company secured a revenue of about US$4,330 million, marking an increase of over 81% against US$2,395 million in the first quarter of fiscal year 2022 (Q1 FY22). According to the firm, this growth in revenue can be attributed to the improved quantity of sales which was offset by a drop in the average realized price of oil.
Also, the company has reported production of 520 Mboe/day (thousand barrels of oil equivalent per day) in Q1 FY23 against 234 Mboe/day in the previous comparable period (Q1 FY22). This marks a 122% increase in production and 113% in sales volume, for the quarter.
Recently, the group announced the plan for developing the Trion resource in Mexico with a total capital expenditure of US$7.2 billion. However, WDS will be deploying around US$4.8 billion as it owns control over 60% of its operations. PEMEX Exploración by Producción (PEMEX) will be managing the rest of the operations.

WDS’ 2023 Guidance
The company is expecting the annual production guidance to be in the range of 180 MMboe and 190 MMboe in FY23. It is anticipating the capital expenditure to be between US$6.0 billion to US$6.5 billion, and the exploration expenditure to be between US$0.3 billion and US$0.4 billion in FY23.
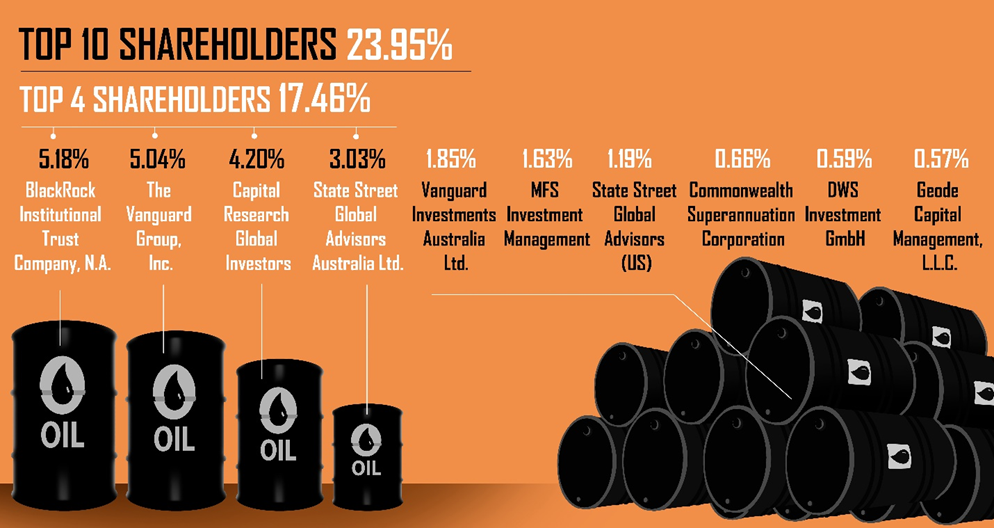
Top 10 Shareholders
The top 10 shareholders collectively form ~23.95% of the total shareholdings. BlackRock Institutional Trust Company, N.A. holds the maximum number of shares with ~5.18% shareholding, followed by The Vanguard Group, Inc. with ~5.04% shareholding, as depicted in the chart below.
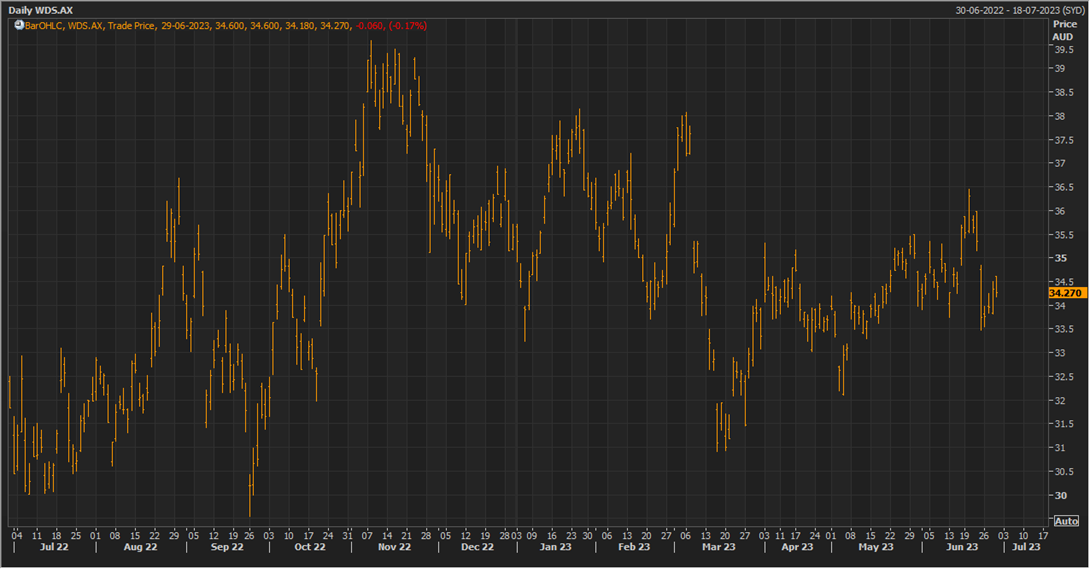
Stock Price Performance
The stock has witnessed a fall of around 2.36% in the past one month. The stock has a 52-week high and 52-week low of GBX 29.55 and GBX 39.58, respectively, and is currently trading below the average of 52-week high-low average.
Please note markets are trading in a highly volatile zone currently due to certain macro-economic and geopolitical tensions prevailing. Therefore, it is prudent to follow a cautious approach while investing.
Note 1: Past performance is not a reliable indicator of future performance.
Note 2: The reference data for all price data, currency, technical indicators, support, and resistance levels is 28 June 2023. The reference data in this report has been partly sourced from EODHD/Others.
