


Highlights
- BT Group PLC (LSE: BT.A) is an FTSE 100 index listed fixed and mobile telecommunications service provider.
- The Group has posted ~62% YoY growth to 8.60 million in 5G connections during FY23.
- Also, the orders in Openreach for FTTP rose by 70% year on year during FY23.
FTSE 100 index listed BT Group PLC (LSE: BT.A) is a fixed and mobile telecommunications service provider. It offers services for managed telecommunications, security and network, as well as IT infrastructure services to its clients across 180 countries.
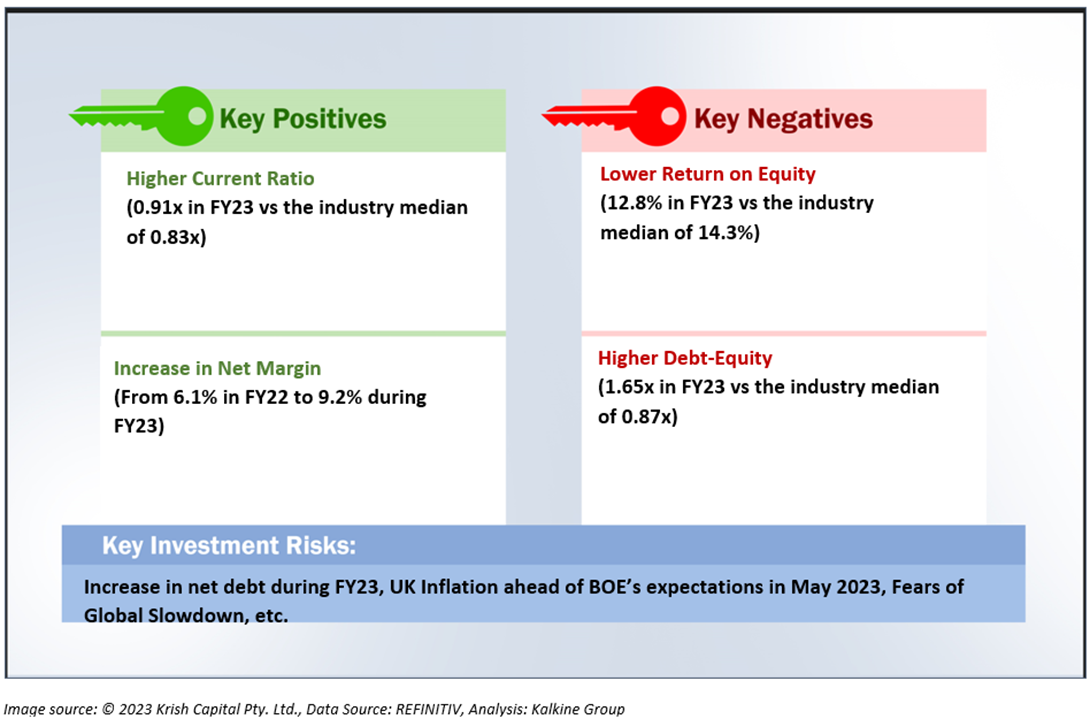
Since April 2020, the company has been able to keep the cost transformation on track with gross annualised cost savings of £2.1 billion as compared to the set target of £3.0 billion. During FY23, the net cash inflow from operating activities saw a year-on-year (YoY) growth of about 13.8%.
During FY23, there has been nearly 62% year-on-year growth in 5G connections. Also, the number of orders in Openreach for FTTP rose by 70% YoY during the year.
The BT Group reported a record quarter in Q4 FY23 with 50% year-on-year growth in Consumer FTTP connections. Overall, there was ~50.4% jump in basic earnings per share during FY23, thanks to the growth in Openreach and Consumer.
Furthermore, the firm has announced to pay a final dividend of 5.39 pence per share in September 2023 with an ex-dividend date of 03 August 2023.
For the fiscal year 2024, the BT Group is expecting the revenue and EBITDA growth on a pro forma basis with normalised free cash flow ranging between £1.0 billion and £1.2 billion. As per the Openreach Board of the firm, BT Group will be able to achieve its target of 25 million premises with FTTP by the end of 2026. The group is looking forward to further expand the network.
Overall, the firm is steering forward to emerge as a leaner business with a brighter future.

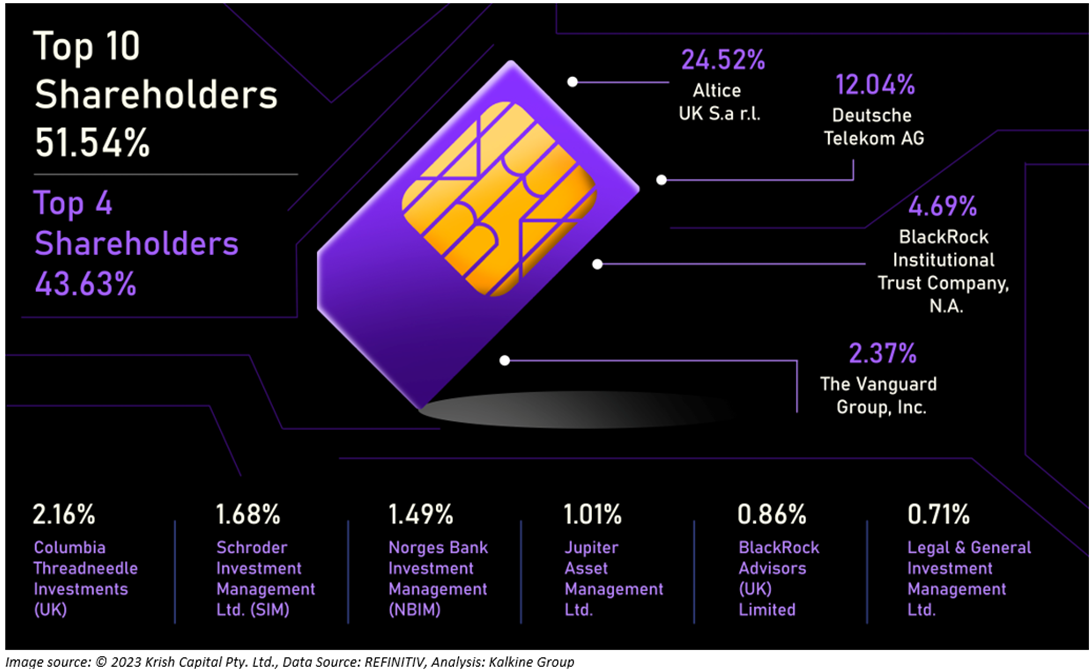
Top 10 Shareholders
The top 10 shareholders of the company collectively hold ~51.54% stake in the company. Altice UK S.a r.l. holds the maximum number of shares with ~24.52% shareholding, followed by Deutsche Telekom AG with ~12.04% shareholding, as depicted in the chart below.
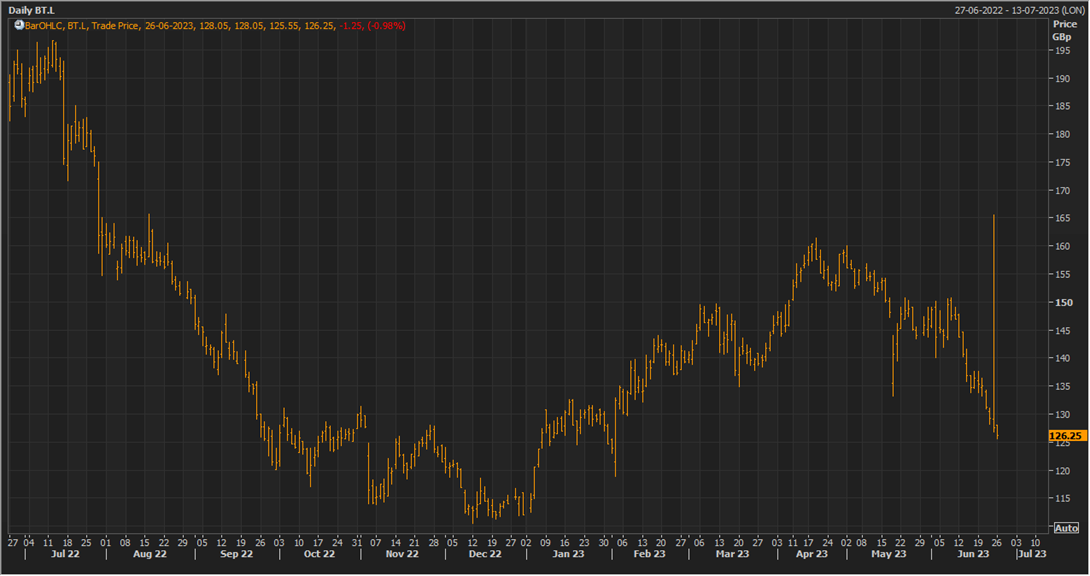
Stock Price Performance
The stock has witnessed a decline of ~12.35% in the last one month and over the last 6 months, it has increased by ~10.72%. The stock has a 52-week low and 52-week high of GBX 110.55 & GBX 196.60, respectively and is currently trading below the average of 52-week high-low.
Data Source: EODHD/Others, Analysis done by Kalkine Group
Please note markets are trading in a highly volatile zone currently due to certain macro-economic and geopolitical tensions prevailing. Therefore, it is prudent to follow a cautious approach while investing.
Note 1: Past performance is not a reliable indicator of future performance.
Note 2: The reference data for all price data, currency, technical indicators, support, and resistance levels is 22 June 2023. The reference data in this report has been partly sourced from EODHD/Others.
