


_07_03_2026_03_50_21_133108.jpg)

Business overview: Hurricane Energy PLC
Hurricane Energy PLC (LON:HUR) was incorporated with an aim to discover and appraise naturally fractured basement reservoirs to develop hydrocarbon resources. The Lancaster field wholly owned by Hurricane is the UK's first producing basement field. The Group's asset is located on the Rona Ridge, in the UK Continental Shelfâs west of Shetland region.
Hurricane Energy PLC issued Trading Update
The Group provided its first quarterly production update, and an operational and trading update ahead of its results for the financial year 2019 on 29th January 2020. The Groupâs revenue for the year ended 31st December 2019 was $170 million. The unrestricted cash stood at $157 million at the year-end, $25 million of which is anticipated to be utilised in relation to the groupâs net payables position, after deducting amounts due from the groupâs joint venture partner.
The Lancaster EPS production of oil was 15.4k barrels per day in the third quarter of 2019. The Lancaster EPS production of oil stood at 11,800 barrels per day in Q4 FY19. The Group continued robust production performance from the Lancaster EPS (Early Production System), driven by the well productivity above pre-start-up anticipations and Facility availability above 90 per cent. This was significantly above from the guidance of oil 9,000 barrels per day. This was an increase from the updated guidance of oil of 11,000 barrels per day. The production was 3 million barrels of oil, and its oil sales stood at 2.9 million barrels of oil across seven cargoes in the financial year 2019.
Hurricane Energy PLC -Stock price performance
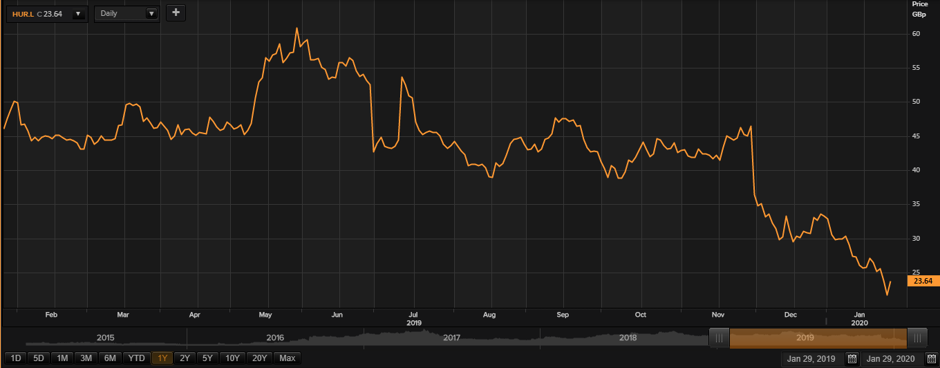
Daily Chart as at Jan-29-20, after the market close (Source: Thomson Reuters)
On 29th January 2020, at the time of writing (after the market close, GMT 4:40 PM), Hurricane Energy PLC shares last traded at GBX 23.64, up by 9.44 per cent against its previous day closing price. Stock's 52 weeks High and Low is GBX 64.70/GBX 21.60. At the time of writing, the share was trading 63.46% lower than its 52w High and 9.44% higher than its 52w low. Stockâs average traded volume for 5 days was 13,350,264.20; 30 days - 12,301,382.17 and 90 days - 11,258,412.79. The average traded volume for 5 days was down by 8.53% as compared to 30 days average traded volume. The companyâs stock beta was 1.29, reflecting higher volatility as compared to the benchmark index. The outstanding market capitalisation was around £431.10 million.
Business overview: Hargreaves Services PLC
United Kingdom based Hargreaves Services PLC (LON:HSP) is a diversified group, which is involved in the delivery of projects and services related to the energy, infrastructure and property sectors.
The Group is specialised in the provision of haulage services, waste management, import of minerals, mining activities and processing, together with earthmoving and related activities.
The Group operates coal surface mines in Scotland, England and Wales for producing coal. The Group is capable of sourcing, production, processing, handling and transportation of a wide variety of materials in bulk quantities.
The Group also offers services such as transport, handling, and recycling of waste for the domestic and industrial sectors. The Group is based in Durham, the UK. The company is a service provider to supply chain management companies, heavy industries, mining companies and Civil Engineering industries.
Recent Business performance of Hargreaves Services PLC for H1 FY20
On 29th January 2020, the Group announced its interim results for the six-month period ended 30th November 2019.
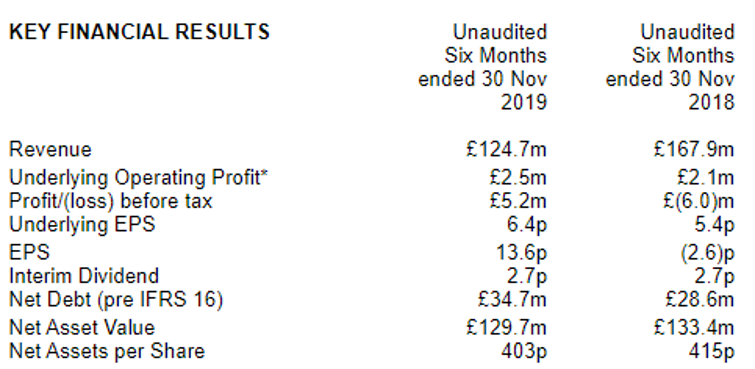
(Source: Companyâs filings, London Stock Exchange)
The Groupâs Revenue plunged to £124.7 million in the first half of 2020 as compared to £167.9 million in the first half of 2019, however, the Underlying Operating Profit surged to £2.5 million in the first half of 2020 as compared to £2.1 million in the first half of 2019.
The Groupâs Revenue has declined primarily in the Specialist Earthmoving business due to completion of civils contracts in comparison to revenue of £8 million generated from Wolf Minerals Limited (before its liquidation) in the comparative period.
In addition, the Group recorded £2.8 million of exceptional profit during the period as compared to £8.1 million of exceptional loss reported in the comparative period.
 The Groupâs operating profit was recorded at £5.4 million in H1 FY20 as against a loss of £6.1 million in H1 FY19. The Groupâs consolidated profit before taxation was recorded at £5.2 million in H1 FY20 as against a loss of £6.0 million in H1 FY19.
The companyâs Basic underlying earnings per share from continuing operations on a reported basis was 6.4 pence in H1 FY20 as compared to 5.4 pence in H1 FY19.  The net debt of the company was recorded at £34.7 million in H1 FY20 as compared to £28.6 million in H1 FY19 prior to the accounting changes in accordance with IFRS 16, due to higher levels of working capital in the Distribution & Services business.
The Board of the company has proposed an interim dividend of 2.7 pence per share for the period which remained flat in comparison to previous year same period. The interim dividend shall be paid to shareholders on 6th April 2020. The company needs to be prudent in its approach with the UK scheduled to leave the EU on 31 January 2020.
Hargreaves Services PLC -Stock price performance
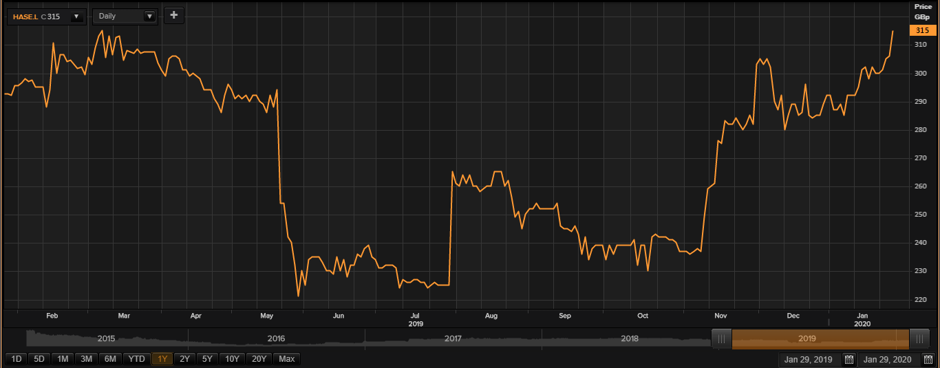
Daily Chart as at Jan-29-20, after the market close (Source: Thomson Reuters)
On 29th January 2020, at the time of writing (after market close, GMT 4:48 PM), Hargreaves Services PLC shares last traded at GBX 315.00, up by 2.94 per cent against its previous day closing price. Stock's 52 weeks High and Low is GBX 320.00/GBX 217.80. At the time of writing, the share was trading 1.56% lower than its 52w High and 44.63% higher than its 52w low. Stockâs average traded volume for 5 days was 96,396.00; 30 days - 25,036.50 and 90 days - 19,470.42. The average traded volume for 5 days was up by 285.02% as compared to 30 days average traded volume. The companyâs stock beta was 0.82, reflecting lower volatility as compared to the benchmark index. The outstanding market capitalisation was around £98.73 million.
Â
Â
