
_07_03_2026_03_50_21_133108.jpg)


Business overview: TUI AG
TUI Group (LON:TUI), formed through the merger of TUI AG and TUI Travel in 2014, is the leading European tour operator with operations spread across 150 plus destinations. The Group specialises in sales and marketing tour and travel services, as well as holiday experiences.
Whether customers are looking for a luxury cruise or expedition experience, TUI can accommodate a range of preferences through its cruise ships across three brands, TUI Cruises, Marella and Hapag-Lloyd. Its hotels operate under an ownership, lease, management or franchise model, while the own brands include Robinson, TUI Magic Life and TUI Blue.
The Groupâs sales division provides several customers every year with personalised holiday experiences through multiple channels and travel agencies. Further, sales and marketing vertical is the major revenue driver in Groupâs earnings, while rest of the earnings are contributed by hotel and cruise activities including 350 plus hotels globally, in hotspots such as the Western and Eastern Mediterranean, North Africa, the Caribbean and Egypt.
TUI announced its trading performance for Q1 FY20
Due to increase in turnover from all other segments, Cruises, and Central region, the overall revenue of the company surged by 6.8 per cent to â¬3,850.8 million on a constant currency basis during the period as compared to â¬3,574.8 million (adjusted) in the first quarter of the fiscal year 2019. Furthermore, the net loss for the period decreased to â¬105.5 million in Q1 FY20 as against â¬112.1 million (adjusted) in the first quarter of the fiscal year 2019.
TUI AG -Stock price performance
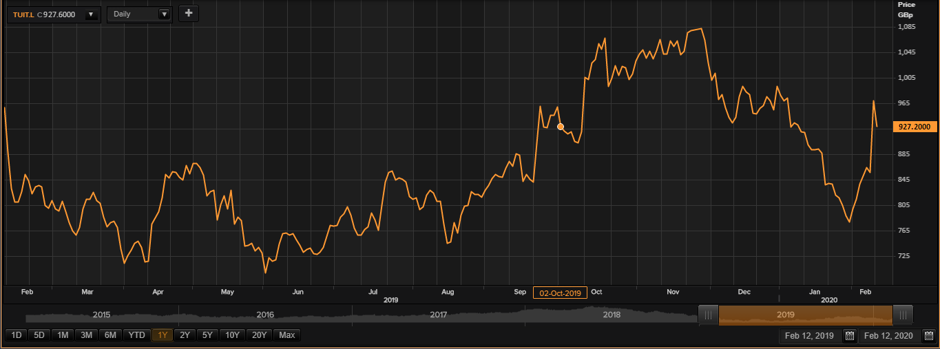
Daily Chart as at Feb-12-20, before the market close (Source: Thomson Reuters)
On 12th February 2020, (before market close, GMT 09:03 AM), TUI AG shares were trading at GBX 927.20, showing decline of 4.20 per cent against its previous day closing price. Stock's 52 weeks High and Low is GBX 1,090.00 /GBX 686.60. At the time of writing, the share was trading 14.94% lower than its 52w High and 35.04% higher than its 52w low. Stockâs average traded volume for 5 days was 3,407,887.00: 30 days - 1,798,132.40 and 90 days - 1,535,703.66. The average traded volume for 5 days was up by 89.52% as compared to 30 days average traded volume. The companyâs stock beta was 0.96, and the outstanding market capitalisation was around £5.64 billion along with a dividend yield of 4.71%.
Business overview: Amino Technologies PLC
The United Kingdom based Technology, Hardware and Equipment Group, Amino technologies Plc (LON:AMO) provides technological services and solutions related to the media and entertainment space. The Groupâs major products include the Amino TV, the Amino OS which is the Groupâs own operating system as well as the Amino VU, which are portable tv devices used for recording and other enterprise activities. The Group also provides Cable IP migration services.
Amino Technologies PLC - trading update for the Financial Year 2019
The trading performance by the Group is expected to be in line with the general expectations of the market, for the year ended 30th November 2019.
The company had a net cash position of $1.4 million by the end of the period, which was less than $20.3 million in the fiscal year 2018, due to the acquisition of 24i and dividend payments. However, the company was able to generate sound cash flows from its operations. The online video specialist, 24i was acquired by the Group in 2019 and was integrated successfully; it continues to make good progress overall. Furthermore, the company has signed a new three-year multi-currency revolving credit facility worth $15 million with Barclays in November 2019.
Dutch mobile virtual network operator, Youfone and Amino Technologies along with 24i have entered into a joint pact, in order to expand latterâs TV and OTT offering and provide a fully integrated, end-to-end video solutions. With 24i's expertise in video experience design and application development, Youfone will deploy an end-to-end solution that combines Amino's IPTV and TV.
Amino Technologies PLC-Stock price performance
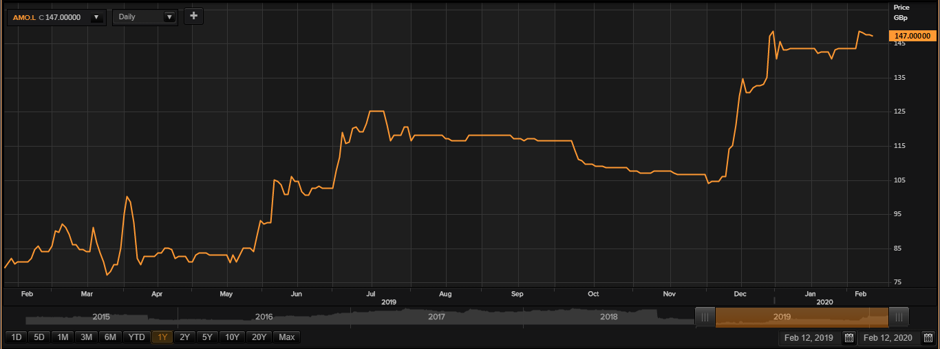
Daily Chart as at Feb-12-20, before the market close (Source: Thomson Reuters)
On 12th February 2020, (before market close, GMT 09:07 AM), Amino Technologies PLC shares were trading at GBX 147.00, lower by around 0.34 per cent against its previous day closing price. Stock's 52 weeks High and Low is GBX 155.00 /GBX 76.00. At the time of writing, the share was trading 5.16% lower than its 52w High and 93.42% higher than its 52w low. Stockâs average traded volume for 5 days was 49,454.20: 30 days - 58,375.77 and 90 days - 112,176.54. The average traded volume for 5 days was down by 15.28% as compared to 30 days average traded volume. The companyâs stock beta was 0.86 and the outstanding market capitalisation was around £112.14 million along with a dividend yield of 4.96%.
Business overview: Diurnal Group PLC
United Kingdom-based, Diurnal Group PLC (LON:DNL) is a clinical-phase pharmaceutical company. The groupâs several products are under clinical trials, namely- Chronocort, Infacort, and Native Oral Testosterone. The group is involved in developing hormone therapeutics for supporting various endocrine situations.
DNL announced interim results for H1 FY20
The company saw strong growth in revenues to £1.1 million during the period with contributions from both Germany and the UK, where Alkindi® was launched along with strong revenue generation from Austria, Sweden, Denmark and Iceland, as compared to £0.2 million in the first half of the fiscal year 2019.
The companyâs gross margin was recorded at 74 per cent in H1 FY20. To further reduce the cost of goods, the company has introduced several measures with its manufacturing partners. Also, the company was able to realise improvements in the margin by addressing manufacturing inefficiencies.
Due to increased revenues, the companyâs operating loss decreased to £4.6 million in H1 FY20 from loss of £9.7 million in H1 FY19. The financial income of the company was £34 thousand in the period. The companyâs Loss per share decreased to 4.7 pence during the period as compared to 13.4 pence in H1 FY19, due to surge in revenues. The company had liquid assets of £4.6 million by the end of the period as compared to £6.9 million in H1 FY19. The companyâs net assets were valued at £7.4 million during the period as against £9.2 million at the end of H1 FY19. Based on current planned expenditure, the Group expects its cash resources to last until at least into the third quarter of 2020.
Diurnal Group PLC-Stock price performance
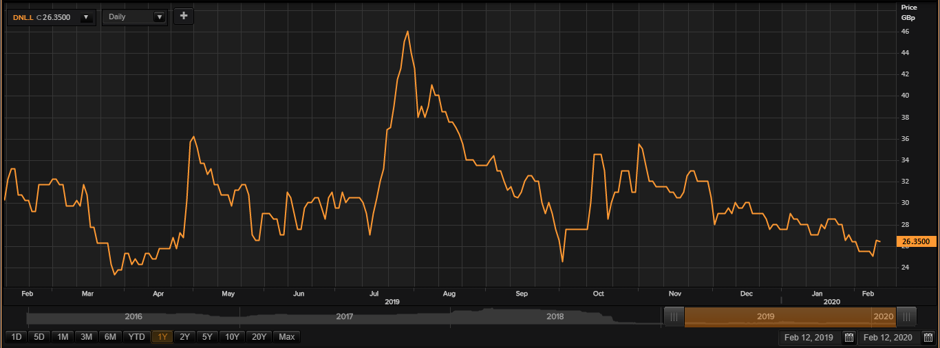
Daily Chart as at Feb-12-20, before the market close (Source: Thomson Reuters)
On 12th February 2020, at the time of writing (before market close, GMT 09:11 AM), Diurnal Group PLC shares were trading at GBX 26.35, down by 0.57 per cent against its previous day closing price. Stock's 52 weeks High and Low is GBX 47.00 /GBX 22.78. At the time of writing, the share was trading 43.94% lower than its 52w High and 15.67% higher than its 52w low. Stockâs average traded volume for 5 days was 160,924.40: 30 days - 153,251.97 and 90 days - 143,956.49. The average traded volume for 5 days was up by 5.01% as compared to 30 days average traded volume. The companyâs stock beta was 2.54, and the outstanding market capitalisation was around £22.92 million.
