AUS
AUS
 NZ
NZ
 UK
UK
 CA
CA
 USA
USA
 IND
IND

_07_03_2026_03_50_21_133108.jpg)
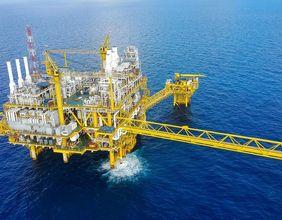




TotalEnergies SE (Paris: TTE | LSE: TTE | NYSE: TTE), the French integrated energy leader, has issued its preliminary second quarter 2026 key indicators and financial highlights, showing a significant rise in Brent crude prices to $103.8 per barrel from $81.1 per barrel in Q1 2026. The company anticipates hydrocarbon production close to 2.4 million barrels of oil equivalent per day (Mboe/d), with ongoing Middle East disruptions impacting output, though less severely than earlier projected. Market participants are focusing on the contrasting segment performances, with Integrated LNG expected to decline sharply while Downstream and Integrated Power segments are forecasted to grow substantially. These preliminary figures remain unaudited and the company warns that actual results may differ from these estimates.
Key Highlights
- TotalEnergies SE (TTE) 6 French integrated energy giant listed on Paris, London, and New York exchanges 6 has released its Q2 2026 preliminary trading data.
- Brent crude averaged $103.8 per barrel in Q2 2026, up from $81.1 in Q1 2026; average LNG price increased to $10.20 per MMBtu from $8.48 per MMBtu over the same timeframe.
- Hydrocarbon production is projected near 2.4 Mboe/d; Middle East conflict impact reduced to about 210 kboe/d from prior guidance of 360 kboe/d, due to UAE offshore ramp-up and regional production restarts.
- Investors should monitor the full audited Q2 2026 earnings, gearing ratio improvement by approximately 2 percentage points, and updates on LNG trading and the $15 billion annual net investment target.
Brent Crude Jumps to $103.8/b in Q2 2026, Boosting TotalEnergies’ Average Liquids Price to $91.6/b
The standout figure in TotalEnergies’ Q2 2026 preliminary update is the sharp increase in Brent crude prices. Brent rose from $81.1 per barrel in Q1 2026 and $63.7 in Q4 2025 to $103.8 per barrel in Q2 2026, marking a quarter-on-quarter gain of approximately $22.7 per barrel and the highest quarterly average since Q3 2025 when Brent was $69.1 per barrel. The euro-dollar exchange rate remained stable at around 1.16 in Q2 versus 1.17 in Q1, indicating minimal currency impact.
TotalEnergies’ average liquids price, calculated as sales in dollar terms divided by volumes for consolidated affiliates excluding oil trading, reached $91.6 per barrel in Q2 2026, compared to $73.7 in Q1 2026 and $65.6 in Q2 2025. The discrepancy between Brent’s $103.8 and the company’s $91.6 average reflects lifting schedule timing, with a significant share of production lifted late in the quarter amid softer crude prices under $70 per barrel at end-June. This timing difference is crucial for investors evaluating realized revenues relative to headline commodity prices.
Middle East Conflict Cuts TotalEnergies’ Q2 Production by Approximately 210 kboe/d, Below Earlier Estimate of 360 kboe/d
TotalEnergies reported that Middle East conflict effects reduced Q2 2026 output by about 210 thousand barrels of oil equivalent per day (kboe/d), significantly less than the previously guided 360 kboe/d. This improvement is attributed to increased production offshore UAE during the quarter and restarts in other regional countries in June. For a company of TotalEnergies’ scale, this 150 kboe/d reduction in disruption impact is a material operational advancement.
Nonetheless, much of the restored production was not physically lifted within the quarter and was accounted for at the end-June crude price below $70 per barrel. This creates an accounting asymmetry where production volumes rose but financial recognition occurred at prices well below the $103.8 Brent quarterly average. Investors should consider this effect when analyzing Exploration and Production segment results.
Exploration and Production Cash Flow Forecasted to Increase by Around $1 Billion Quarter-on-Quarter
TotalEnergies’ preliminary update indicates Exploration and Production cash flow will reflect higher production and improved liquids prices, with a $17.9 per barrel increase in average liquids realization versus a $22.7 per barrel Brent rise. The difference is mainly due to lifting timing weighted toward the quarter’s end with softer prices. Despite this, Exploration and Production cash flow is expected to rise by approximately $1 billion compared to Q1 2026.
The company notes that Exploration and Production results (distinct from cash flow) will also increase but be influenced by accounting impacts from unlifted production. This divergence between cash flow and reported segment results is significant during periods of lifting schedule misalignment, especially given TotalEnergies’ Middle East operations. No specific adjusted net operating income figure was disclosed for Q2.
Integrated LNG Segment Set for Significant Decline Following Gas Trading Underperformance in Q2 2026
TotalEnergies’ Integrated LNG segment is expected to see a notable decrease in cash flow and results in Q2 2026, primarily due to gas trading underperformance amid a flat to declining European gas market. This contrasts with the segment’s outperformance in Q1 2026. LNG remains a strategic business for TotalEnergies, a leading global LNG trader and producer with projects across continents.
Average LNG prices rose to $10.20 per MMBtu in Q2 from $8.48 in Q1, while the European TTF gas benchmark increased to $15.6 per MMBtu from $13.7. Despite higher prices, gas trading losses appear to have outweighed pricing benefits. The company did not specify the extent of the decline, leaving investors awaiting full earnings details.
Integrated Power Segment Expected to Deliver Strong Q2 Cash Flow Growth After EPH Deal Closure on 29 April
In contrast, the Integrated Power segment is forecasted to generate significantly higher cash flow in Q2 2026, driven by the closing of a transaction with EPH on 29 April 2026. TotalEnergies continues expanding its power and renewables footprint as part of its multi-energy strategy. The segment includes electricity generation, renewables, and power trading operations. The EPH deal closing is the main factor behind the anticipated cash flow boost.
Financial terms and incremental cash flow contributions from the EPH transaction were not disclosed. This development underscores TotalEnergies’ strategic focus on lower-carbon energy and positions Integrated Power as a key growth pillar alongside traditional hydrocarbons. Segment performance will be closely watched when full earnings are released.
Downstream Refining and Petrochemical Margins Rebound Sharply in Q2 2026, with ERM Rising to $13.5/b
TotalEnergies’ Downstream segment, covering refining, petrochemicals, oil trading, and marketing and services, is expected to report substantially improved results and cash flow in Q2 2026 versus Q1. Drivers include higher refining and petrochemical margins and sustained strong oil trading results. Marketing and Services is also expected to benefit from seasonal effects similar to Q2 2025.
The European Refining Margin Marker (ERM), representing a basket of crudes, product yields, and variable costs for TotalEnergies’ European refining system, increased to $13.5 per barrel in Q2 2026 from $11.4 in Q1 2026 and $4.7 in Q2 2025. This steady margin recovery provides a meaningful tailwind for Downstream profitability.
TotalEnergies Projects $1–1.5 Billion Working Capital Reduction and 2-Point Gearing Ratio Improvement in Q2 2026
The update reveals an expected working capital decrease between $1 billion and $1.5 billion in Q2 2026, mainly due to lower hydrocarbon prices affecting inventory valuations at quarter-end. This working capital release would supplement cash generation beyond operating cash flow and partially offset capital investment pressures.
Quarterly net investments are anticipated to align with the $15 billion annual guidance, with gearing ratio improving by about 2 percentage points by Q2 end. This improvement suggests a stronger balance sheet and enhanced financial flexibility for capital returns or further investments. The company did not specify the absolute gearing level, requiring comparison with prior Q1 2026 figures.
TotalEnergies 2026 Sensitivity Analysis: $10/b Change in Liquids Prices Estimated to Affect Net Income by $2.3 Billion
The announcement includes TotalEnergies’ 2026 sensitivity framework, helping investors assess financial impacts of market fluctuations. A $10 per barrel move in average liquids price (in a $60–70 Brent range) is projected to affect adjusted net operating income by $2.3 billion and cash flow from operations by $2.8 billion, highlighting crude price significance.
Additional sensitivities include: a $2 per MMBtu change in European TTF gas price impacting adjusted net operating income and cash flow by $0.4 billion each; a $1 per barrel change in ERM affecting adjusted net operating income by $0.3 billion and cash flow by $0.4 billion; and a $0.10 per euro shift in dollar exchange rate influencing adjusted net operating income by $0.1 billion with negligible cash flow effect. The dollar-euro sensitivity mainly applies to Refining and Chemicals. These sensitivities are updated annually and actual results may vary.
Organic Growth and $15 Billion Annual Net Investment Guidance Remain Core to TotalEnergies’ 2026 Strategy
The preliminary update reaffirms key strategic elements underpinning TotalEnergies’ 2026 financial outlook. Second quarter hydrocarbon production is expected to reflect solid organic growth of 4% quarterly, driven by ongoing upstream investments across the Middle East, Africa, North Sea, Americas, and Asia Pacific. The near 2.4 Mboe/d production base demonstrates the company’s global operational scale.
The $15 billion annual net investment target remains unchanged, with quarterly net investments aligned accordingly. TotalEnergies’ diversified multi-energy portfolio spans hydrocarbons, LNG, integrated power and renewables, refining, petrochemicals, and marketing, creating resilience and complexity in quarterly results interpretation. Capital allocation appears consistent with prior guidance at this stage.
Investor Risks Highlighted: Unaudited Figures, Lifting Timing, and Gas Trading Volatility
Investors should note several risks in this preliminary update. First, all data is unaudited and internally reported; actual results may differ materially from these estimates. The company disclaims liability for use of this data as permitted by law.
Second, the lifting schedule timing can cause significant divergence between headline commodity prices and realized revenues, exemplified by Middle East production recognized at under $70 per barrel despite a $103.8 Brent average. Third, the Integrated LNG segment’s gas trading underperformance underscores potential volatility in trading activities, which can produce negative surprises. The magnitude of this impact remains undisclosed, pending full earnings publication.
This article is for informational purposes only and does not constitute investment advice or recommendations. Information is based on publicly available company disclosures believed accurate at publication but is not guaranteed. Past performance does not predict future results. Readers should seek independent financial, legal, or investment advice before acting. TotalEnergies SE shares trade on multiple exchanges; investment values can fluctuate and may result in losses.