


To stabilise profitability and position itself for the growth, Macyâs Inc has announced a three-year plan and an updated strategy. The company has expressed faith in this new strategy to stabilise profitability and drive growth and has stated that it shall direct its resources on its profitable business lines and explore new opportunities rather than focussing on the unhealthy parts of the business. The Group stated that it understands the needs to improve the bottom-line and believes that the updated strategy will allow them to set the platform for sustainable and profitable growth along with stabilised margins in 2020.
The company stated that it would make significant structural changes to reduce costs by encouraging cross-functional roles within teams and minimizing redundancies. These changes are deemed necessary, deep and will have an impact on every area of the business. These changes will make the company a better fit in todayâs competitive retail market.
The company further stated that it has five components to work upon as per the Polaris strategy, namely, Strengthen Customer Relationships, Curate Quality Fashion, Accelerate Digital Growth, Optimize Store Portfolio and Reset Cost Base.
For strengthening customer relationships, the company is focussing on creating lifetime value for customers, extending its loyalty offers and accelerating personalisation and monetisation programs.
The company is known to curate exclusive products and the best brands on the latest trends. The company plans to roll out four $1 billion brands with higher margins and continues to invest in mobile applications and websites to give end-users an amazing shopping experience as Macys.com helps in accelerating growth and strengthen profitability. The macys.com headquarters as per the new plan will be relocated to New York City from San Francisco.
In addition, the company plans to shut down its least productive stores (nearly 125) over the period of next three years to optimise its storesâ portfolio. Furthermore, in a move to reset its cost base, the company is planning job cuts of around 2,000 positions. The company will also be closing itâs downtown Cincinnati, San Francisco, and Ohio offices.
The company expects this strategy to result in nearly $1.5 billion of annual gross savings in the period between 2020-22. The expected gross savings of the company are likely to be around $600 million for the year 2020, which shall contribute to the operating margin.
Business Overview: Macyâs Inc (NYSE:M)
One of the nationâs premier retailers, Macyâs Inc has a representative base of around 130 thousand with fiscal 2018 sales recorded at $24.971 billion. The Group has corporate offices in Cincinnati, Ohio, and New York. The Stock of the company trades with the ticker symbol M on the NYSE.
The Group operates under the brand of Macyâs and Bloomingdale in approximately 680 department stores, which include Macyâs Backstage, Bluemercury and Bloomingdaleâs The Outlet and approximately 190 specialty stores.
Macyâs Inc operates through web portals such as macys.com, bloomingdales.com and bluemercury.com and through physical stores in more than 40 states such as the District of Columbia, Guam and Puerto Rico. In addition, under the license agreement with Al Tayer Group LLC, the Group operates stores in Dubai and Kuwait.
The success mantra of the company is its culture; the company focuses on what is to be done and how it is to be done. The company delivers on its promises made to its stakeholders as it has invested itself in creating a culture of shared expectations. The Group has a clear set of defined values and vision. The company has invested in training to bring all its colleagues on the same page to create an inclusive and safe workplace.
(Source: Companyâs website)
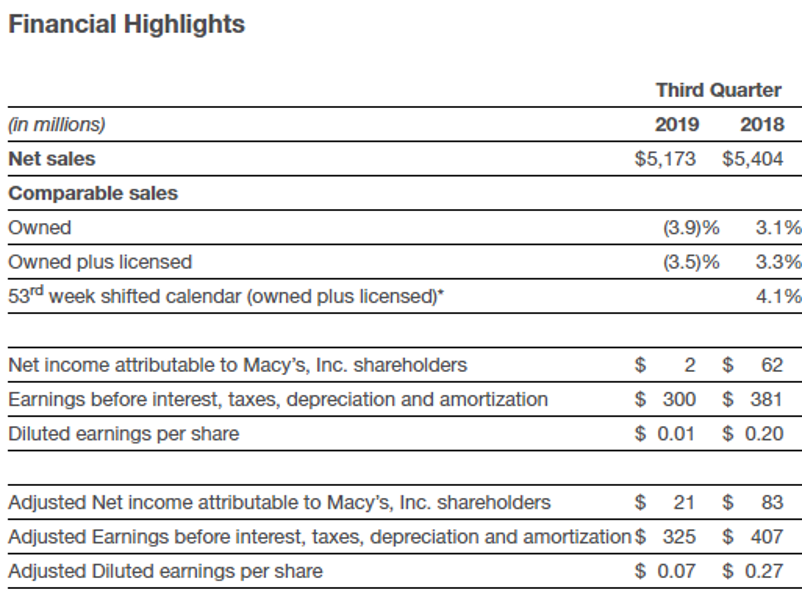
The company reported its operational highlights for the third quarter 2019 period ended 02 November 2019. The company reported net sales of $5,173 million during the period as compared to $5,404 million in the previous corresponding period. The company reported cost of sales at $3,106 million as compared to $3,226 million in the same period last year. Selling, general and administrative (SGA) expenses stood at $2,202 million as compared to $2,255 million in the previous corresponding period. The companyâs net income was recorded at $2 million as compared to $62 million in the previous corresponding period.
Macyâs Inc -Stock Price Performance
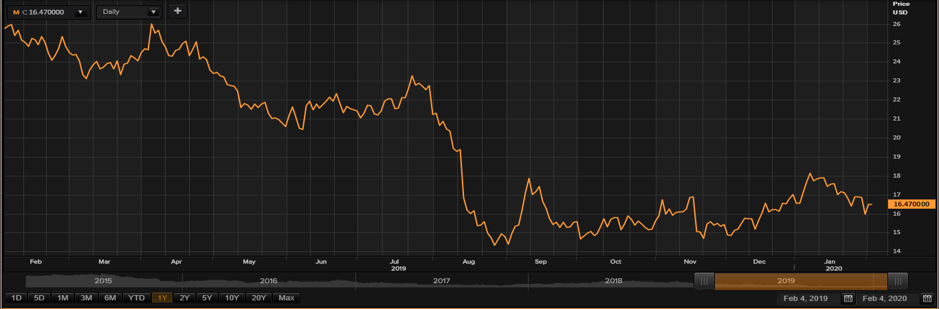
Daily Chart as at Feb-04-20, after the market close (Source: Thomson Reuters)
At the time of writing (after the market close, at 11:55 AM GMT), shares of the Macyâs Inc were at USD 16.47 an upside of 30.01 per cent against the previous day closing price. The total M-cap (market capitalisation) of the company stood at $5.09 billion with an annual dividend yield of 9.17 per cent.
Daily Traded Volume Summary
The 5-day average daily traded shares, which exchanged hands were recorded at 12,939,724.60, and was approximately 0.02 per cent less than the 30-day average daily traded shares, which exchanged hands at the NYSE (New York Stock Exchange). At the time of writing, after the market close, the dayâs traded volume of the shares of the company was around 1,015 and number of trades executed stood at 7 at the NYSE (New York Stock Exchange).
52-week High/Low range
In the past 52 weeks, shares of the Macyâs Inc have hovered between a high price level of USD 26.33 (as on 5th April 2019) and a low-price level of USD 14.11 (as on 3rd October 2019). At the current level of trading, as quoted in the price chart, shares traded around 37.45 per cent below the 52-week high and were 16.73 per cent above the 52-week low.
Price Performance (in percentage)
The shares of the Macyâs Inc have delivered a negative price return of 36.34 per cent on a Year on Year (YoY) basis, better compared to the benchmark index, as the benchmark index gave 47.39 per cent negative return over the same period. In addition, the stock has given a negative price return of approximately 3.12 per cent on a year-to-date (YTD) time frame and was down by approximately 0.36 per cent in the last one month.
Simple Moving Average (SMA)
From the Simple Moving Average standpoint, shares traded above the 60-day simple moving average price. However, the shares traded below its 200-day and 30-day SMA price points.
Relative Strength Index (RSI)
The RSI indicator for the shares of the company for the 3-days, 9-days and 14-days was recorded at 47.20, 43.11 and 45.98, respectively. Also, the stockâs 30-days RSI was recorded at 48.66.
