


2020 started on a good note, with the UK is all set to deliver the first stage of Brexit as on January 31, 2020 and a phase-1 trade deal having already been concluded between US and China. These two events have fuelled huge swings in the global financial markets over the past one and half years. Also, many global broad-based indices have registered their lifetime highs; However, this was not supposed to last very long. The spread of coronavirus from China to almost ten other countries dragged global benchmark indices from their highs and month-to-date return turned negative in the major markets. Particularly, the UK benchmark indices, which reported gains in the early trading sessions of January 2020, plummeted and are now delivering negative price return on a Month-to-day (MTD) basis. The broader index of the UK the FTSE 100 index, which gauges movement in 100 large-cap companies listed and traded on the London Stock Exchange, slumped approximately 0.82% on an MTD basis; also its constituents are more international companies which derive large portion of their sales and earnings from global markets and hence more exposed to the global good and bad events occurring. Meanwhile, the FTSE 250 Index which gauges movement in the top-250 medium sized companies, which handed approximately 6.0% in December 2019 and extended rally during early trading days of January 2020, plummeted approximately 2.06% on an MTD basis as on January 28, 2020.
However, FTSE 250, which is also considered as a true reflector of UKâs economic health, delivered a negative price return in January 2020, primarily because of uncertainties hovering over the Brexit transition period. As many experts from vast domains of specialisations commented that it is impossible to complete a comprehensive trade deal with the European Union in the 11-month time period and if the negotiations failed to materialise in a deal, then Britain would fall out of the EU's single market and customs union effective from January 01, 2021, and it has to invoke WTO trade guidelines to conduct business with the erstwhile bloc. This would have economic ill-impact on both the sides.
However, officials from both the sides are trying their best to complete the transition within the dedicated time frame.
Despite humungous volatilities resulting from the Brexit transition to the spread of coronavirus in China and ten other countries, there were specific counters which have outperformed the trend in broader indices and reported appreciation in prices on a MTD basis.
3-Stocks which delivered an alpha on an MTD basis to January 28, 2020, are: CRST, DLG, VOD
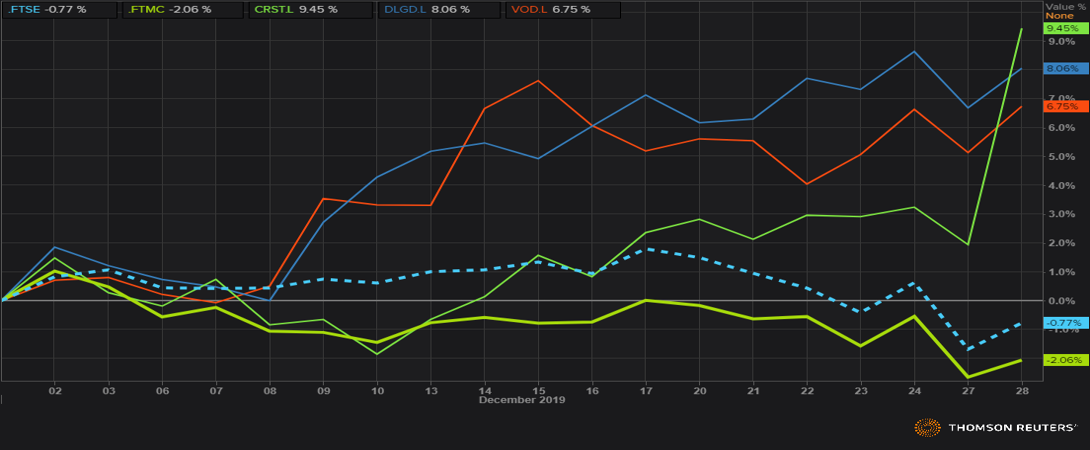
 MTD daily price chart (as on January 29, 2020, before commencement of trading hours). Source: Thomson Reuters.
Crest Nicholson Holdings PLC: The £1.21bn market cap LON: CRST is a United Kingdom-based home construction company. Its product mix comprises of homes for first-time buyers to large family home, and a mix of houses, apartments and commercial premises as a part of its product portfolio. Since February 18, 2013, its shares are listed and traded on the main market of the London Stock Exchange. Also, the outstanding market capitalisation of the group ranks it among the mid-capitalization stocks listed and traded on the main market segment of the London Stock Exchange.
Shares of home construction company outperformed broader indices on a MTD basis and turned out to be an alpha stock for the same time. On an MTD basis, its shares surged approximately 9.4% where its benchmark FTSE 250 slumped by 2.06% in the same time. This reflects that relative outperformance between CRST stocks and FTSE 250 index of 11.46%, which is significant.
Despite an outperformance it reported against the broader market, its shares were also offering a decent dividend yield of 7.0%, whereas benchmark FTSE 250 and UKâs broader index FTSE 100 offering dividend yield in the range of 4-4.5%, respectively. This reflects that the companyâs dividend yield is approximately 1.5 times higher against the benchmarkâs dividend yield.
Also, technical trends are moving favourably for the stocks, as its shares ended January 28, 2020, session significantly above its 5-day, 10-day, 20-day, 30-day, 50-day, 100-day and 200-day simple moving average prices, which is typically considered to be a favourable technical trend in any underlying security.
Direct Line Insurance Group PLC: United Kingdom-based LON: DLG is a non-life insurance service provider. The £4.6bn market-cap company's operating segments include Motor, Home, Rescue, other personal lines and commercial. Since October 16, 2012, its shares are trading on the main segment of the London Stock Exchange, and outstanding market capitalisation of the group ranks it among the mid-capitalization stocks listed and traded on the LSE. Also, the group is a constituent company of the FTSE 250 index.
Shares of Property and Casualty Insurance provider bagged approximately 8.1% on an MTD basis to January 28, 2020 and outperformed its benchmark indexâs performance during the same period. The relative outperformance between the company and FTSE 250 index stood at 10.12%, and stock generated an alpha in the same period.
Despite a relative outperformance it registered against the benchmark, its shares are offering a lucrative dividend yield of 6.3%, which is considerably above the benchmark index's dividend yield of approximately 4%. Also, the group's current dividend yield is approximately 1.58 times that of the benchmark.
From the technical standpoint, the moving average convergence divergence in the stock is rising, with the difference between 12-day exponential moving average and 26-day exponential moving average turning out to be positive, which typically is a positive indicator. Also, the stock traded well above its crucial short-term and long-term moving averages of 5-day, 10-day, 30-day, 50-day, 100-day and 200-day, which is again a positive trend in any underlying security. Also, a price above the long-term support level of 200-day SMA typically is considered a long-term uptrend in any underlying and also act as the long-term support for the underlying.
Vodafone Group PLC: UK large-cap telecommunication services provider is LON: VOD is a £41.93bn market-cap company. The group provides a range of services including mobile communication, fixed communication, unified communication, internet of things (IoT), cloud hosting and security & carrier services. Also, the group has forayed into offering fifth-generation mobile networking, a game-changing technology. Since October 26, 1988, its stocks are trading on the main market segment of the London Stock Exchange and are a constituent company of the FTSE 100 index.
Shares of telecommunication services provider jumped 6.7% to GBX 156.66 on an MTD basis to January 28, 2020, whereas in the same period its benchmark index, the FTSE 100, delivered a negative return of 0.82%. The relative outperformance of VOD stocks stood at approximately 7.5%.
Also, the company is offering a dividend yield of 4.8%, which is relatively higher against the benchmark FTSE 100âs dividend yield of 4.33%.
Despite a relative outperformance the companyâs stock recorded on an MTD basis, its shares traded below its 5-day simple moving average; however, they traded well above its 10-day, 30-day, 50-day and 200-day SMAs, which is a positive measure. And, the moving average convergence divergence is rising, with the difference between 12-day exponential moving average and 26-day exponential moving average being positive, which typically is a positive indicator.
Also, the 14-day and 9-day Relative Strength Index in the stock is hovering in a neutral zone.
