.jpg)


Copyright © 2021 Kalkine Media Pty Ltd.
The S&P/TSX Composite Index, key index of the Toronto Stock Exchange, hit a new record high on Thursday, surging 155 points or 0.83% to 18,844.57. During the day trading session, the index tested a day high of 18,881.17 and a low of 18,778.80. The index is up for fifth consecutive day.
It added approximately 3.4% month-to-date.
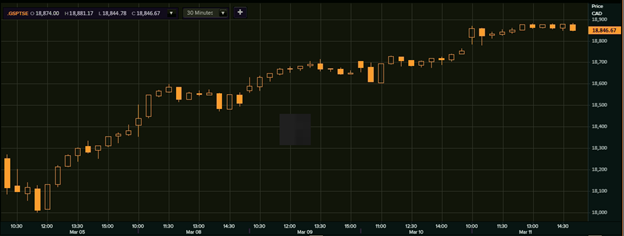
5-day Price Chart (as on March 11, 2021). Source: EODHD/Others (Thomson Reuters)
The rally was driven by strength in the healthcare sector (up 5.9%), metals & mining (3.6%), information technology (2.5%), and utilities (up 1.08%) respectively.
All the eight-constituent sector of the TSX Composite traded in green.
Movers and Laggards
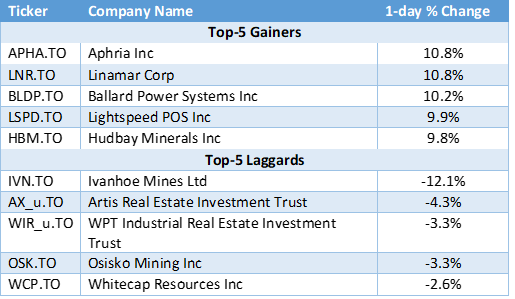
Source: EODHD/Others (Thomson Reuters)
Active Volume: ClearStream Energy Services Inc. (14.76 million shares exchanged), Ivanhoe Mines Ltd. (12.73 million changes hands), and Canadian Natural Resources Limited (11.94 million traded), were among the most active stocks from the volume standpoint.
On Wall Street: Major equity indices of the Wall Street recorded new high on Thursday, with Dow Jones recording a new high of 32,661.59, before settling 0.58% higher at 32,485.59. The S&P 500 index registered a new high of 3,960.27, before settling 1.14% higher at 3,939.34. The Nasdaq Composite Index surged 2.52% to 13,398.67.
Commodity and Money Market Updates
Gold traded slightly higher on Thursday to US$1,722.60/oz vs US$1,721.80/oz on Wednesday.
Energy Price moved higher with Brent Oil traded 2.55% higher at US$69.63/bbl, and American WTI Crude surged 2.45% higher at US$66.02/bbl, respectively.
United States 10-Year Treasure Yield increased 0.92% to 1.535%.
Yield on the Canada 10-Year Government Bond moved 2.55% to 1.486% respectively.
