TSX posts weekly loss with oil prices in choppy waters, loonie down

2 min read | December 16, 2021 10:30 PM PST | By Sundeep Radesh

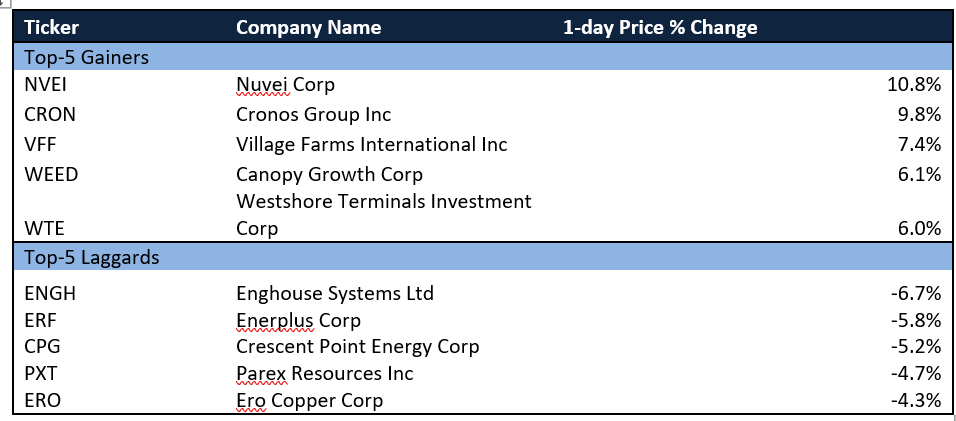
The TSX Composite Index ended a touch lower Friday, December 17. Energy sank two per cent but was offset by healthcare, which gained three per cent. In fact, of the top five biggest gainers of the day, three were cannabis stocks. Cronos Group Inc was up 9.8 per cent, Village Farms International Inc rose 7.4 per cent and Canopy Growth Corp gained 6.1 per cent.

The index lost 0.73 per cent last week to end at 20,739.19. It’s possibly due to a combination of factors like the supply crisis, inflation, Omicron and the impending rise in interest rates.

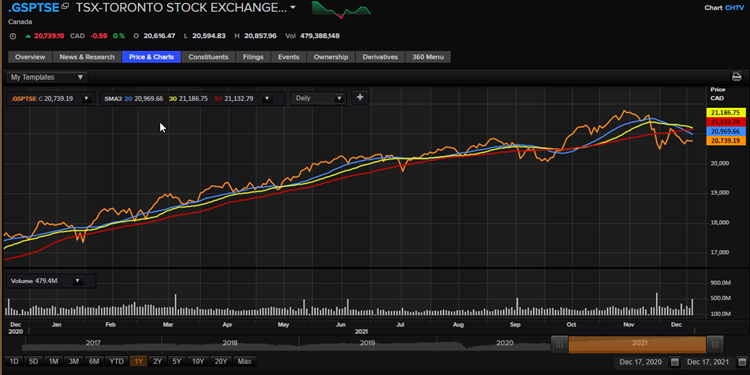
One-year price chart (December 17). Analysis by © 2021 Kalkine Media®

Volume actives
Baytex Energy Corp saw 33 million shares traded, making it the most active stock. It was followed by Tamarack Valley Energy Ltd. that saw 20.1 million shares switch hands and TC Energy Corporation saw 17.39 million shares traded.

Movers and laggards

Wall Street update

Wall Street saw some losses after Pfizer announced it saw the pandemic extending to 2024. The indices had a day of erratic trading.

The Dow was down 1.48 per cent, 532.20 points, to 35,365.44 and the S&P 500 sank 1.03 per cent, 48.03 points, to 4,620.64 points. Nasdaq fell 0.07 per cent, 10.76 points, to 15,169.68.

Commodities update

Gold rose 0.37 per cent to US$ 1,804.90. Oil prices have been in choppy waters off late. Brent oil fell two per cent to US$ 73.52/bbl. Crude oil was down 2.1 per cent to US$ 70.86/bbl

Currency news

The loonie posted a 0.91 per cent loss Friday while USD/CAD ended at 1.2886. The US Dollar Index was at 96.57, up 0.54 per cent against the basket of major currencies.

Money market

The US 10-year bond yield fell 1.19 per cent to 1.407 and the Canada 10-year bond yield fell one per cent to 1.321.


Disclaimer

The content, including but not limited to any articles, news, quotes, information, data, text, reports, ratings, opinions, images, photos, graphics, graphs, charts, animations and video (Content) is a service of Kalkine Media LLC (Kalkine Media, we or us) and is available for personal and non-commercial use only. The principal purpose of the Content is to educate and inform. The Content does not contain or imply any recommendation or opinion intended to influence your financial decisions and must not be relied upon by you as such. Some of the Content on this website may be sponsored/non-sponsored, as applicable, but is NOT a solicitation or recommendation to buy, sell or hold the stocks of the company(s) or engage in any investment activity under discussion. Kalkine Media is neither licensed nor qualified to provide investment advice through this platform. Users should make their own enquiries about any investments and Kalkine Media strongly suggests the users to seek advice from a financial adviser, stockbroker or other professional (including taxation and legal advice), as necessary. Kalkine Media hereby disclaims any and all the liabilities to any user for any direct, indirect, implied, punitive, special, incidental or other consequential damages arising from any use of the Content on this website, which is provided without warranties. The views expressed in the Content by the guests, if any, are their own and do not necessarily represent the views or opinions of Kalkine Media. Some of the images/music that may be used on this website are copyright to their respective owner(s). Kalkine Media does not claim ownership of any of the pictures/music displayed/used on this website unless stated otherwise. The images/music that may be used on this website are taken from various sources on the internet, including paid subscriptions or are believed to be in public domain. We have used reasonable efforts to accredit the source (public domain/CC0 status) to where it was found and indicated it, as necessary.


Sponsored Articles


Investing Ideas

Previous Next