TSX falls as tech & healthcare sectors sink, manages weekly gain

2 min read | December 12, 2021 10:30 PM PST | By Sundeep Radesh

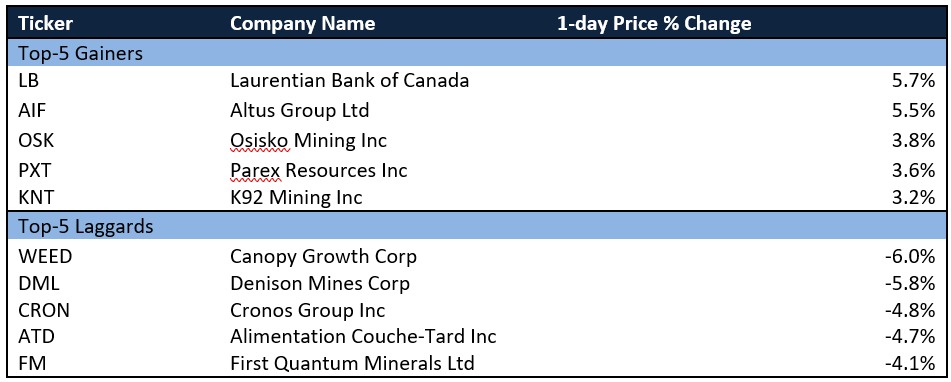
The TSX Composite Index fell Friday, December 10, for the third day in a row and landed at 20,890.62. Friday’s fall was a marginal 0.17 per cent, 34.87 points, as IT and healthcare lagged. Canopy Growth Corp was down six per cent.

Nonetheless, after posting three weekly losses beginning November 14, the index posted a weekly gain of 1.25 per cent after gaining 2.55 per cent on Monday and Tuesday.

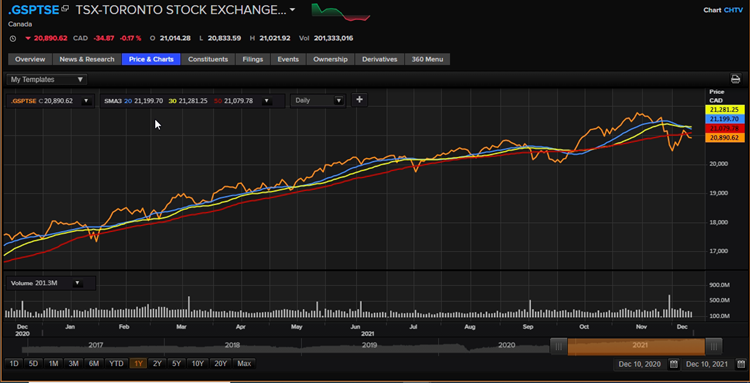
One-year price chart (December 10). Analysis by © 2021 Kalkine Media®

Volume actives

Enbridge Inc saw 7.73 million shares traded, making it the most active stock. It was followed by Star Diamond Corporation that saw 7.64 million shares switch hands and Suncor Energy Inc saw 7.28 million shares traded. All three closed having made gains.

Movers and laggards

Wall Street update

The Fed has spoken about speeding up the tapering process and inflation data released Friday showed why. US consumer prices spiked 0.8 per cent in November. Consumer prices were up 6.8 per cent year-on-year, the biggest rise in nearly 40 years.

However, on Wall Street, there were some gains made. Nasdaq rose 0.73 per cent, 113.23 points, to 15,630.60. The Dow was up 0.6 per cent, 216.30 points, to 35,970.99 and the S&P 500 grew 0.95 per cent, 44.57 points to 4,712.02.

Commodity update

Gold was up 0.46 per cent to US$ 1,784.80. Brent oil rose nearly one per cent to US$ 75.15/bbl. Crude oil gained over one per cent to US$ 71.67/bbl.

Currency news

The loonie posted a marginal 0.06 per cent loss Friday while USD/CAD ended at 1.2720. The US Dollar Index was at 96.10, down 0.18 per cent against the basket of major currencies.

Money market

The US 10-year bond yield fell 1.02 per cent to 1.482 and the Canada 10-year bond yield fell 3.43 per cent to 1.465.


Disclaimer

The content, including but not limited to any articles, news, quotes, information, data, text, reports, ratings, opinions, images, photos, graphics, graphs, charts, animations and video (Content) is a service of Kalkine Media LLC (Kalkine Media, we or us) and is available for personal and non-commercial use only. The principal purpose of the Content is to educate and inform. The Content does not contain or imply any recommendation or opinion intended to influence your financial decisions and must not be relied upon by you as such. Some of the Content on this website may be sponsored/non-sponsored, as applicable, but is NOT a solicitation or recommendation to buy, sell or hold the stocks of the company(s) or engage in any investment activity under discussion. Kalkine Media is neither licensed nor qualified to provide investment advice through this platform. Users should make their own enquiries about any investments and Kalkine Media strongly suggests the users to seek advice from a financial adviser, stockbroker or other professional (including taxation and legal advice), as necessary. Kalkine Media hereby disclaims any and all the liabilities to any user for any direct, indirect, implied, punitive, special, incidental or other consequential damages arising from any use of the Content on this website, which is provided without warranties. The views expressed in the Content by the guests, if any, are their own and do not necessarily represent the views or opinions of Kalkine Media. Some of the images/music that may be used on this website are copyright to their respective owner(s). Kalkine Media does not claim ownership of any of the pictures/music displayed/used on this website unless stated otherwise. The images/music that may be used on this website are taken from various sources on the internet, including paid subscriptions or are believed to be in public domain. We have used reasonable efforts to accredit the source (public domain/CC0 status) to where it was found and indicated it, as necessary.


Sponsored Articles


Investing Ideas

Previous Next