


Highlights
- Stanmore Resources reported a net loss of USD 50.5 million for 1H FY2025, compared to a profit of USD 136.3 million in the prior year.
- Saleable coal production declined 4% YoY to 6.5 million tonnes, impacted by adverse weather conditions.
- The company maintained its full-year production guidance of 13.8–14.4 million tonnes.
Stanmore Resources Limited (ASX:SMR), an Australian metallurgical coal producer with operations in Queensland, witnessed decline in the group production in the first half of the financial year 2025 (1HFY25) to 6.5Mt, compared to 6.8Mt in 1HFY24. Production was constrained by prolonged wet weather conditions in early 2025, which disrupted mining activity and logistics infrastructure.
The company posted revenue of USD 867.2 million in 1HFY25, representing a 29% decline compared to USD 1,226.0 million in the prior year period. Net loss for the period reached USD 50.5 million, a reversal from a profit of USD 136.3 million in 1HFY2024, reflecting a 137% YoY change.
Despite lower sales volumes and a drop in average realised pricing, the company reported improvements in FOB cash costs, supported by reduced mining activity, cost management initiatives, and favorable foreign exchange movements.
Recent Business Update
On 25 July 2025, the company announced the appointment of Mr. Ben Gargett as an alternate director for Mr. Matthew Latimore. Mr. Gargett, a Chartered Accountant and former PwC partner, currently serves as CFO of M Resources Group and brings sector expertise to Stanmore’s board.
Outlook
Stanmore expects production to improve in the second half of FY2025 and support full-year cost guidance. The company has maintained its full-year saleable production guidance between 13.8 and 14.4 million tonnes.
Capital expenditure is projected to rise in the second half, with spending anticipated between USD 80 million and USD 90 million, following delays earlier in the year due to weather-related impacts.
Completion of the MRA2C creek diversion project ahead of schedule and under budget, supported the ramp-up of operations at South Walker Creek. Alongside cash preservation measures, this is expected to improve Stanmore’s growth pipeline.
Share performance of SMR
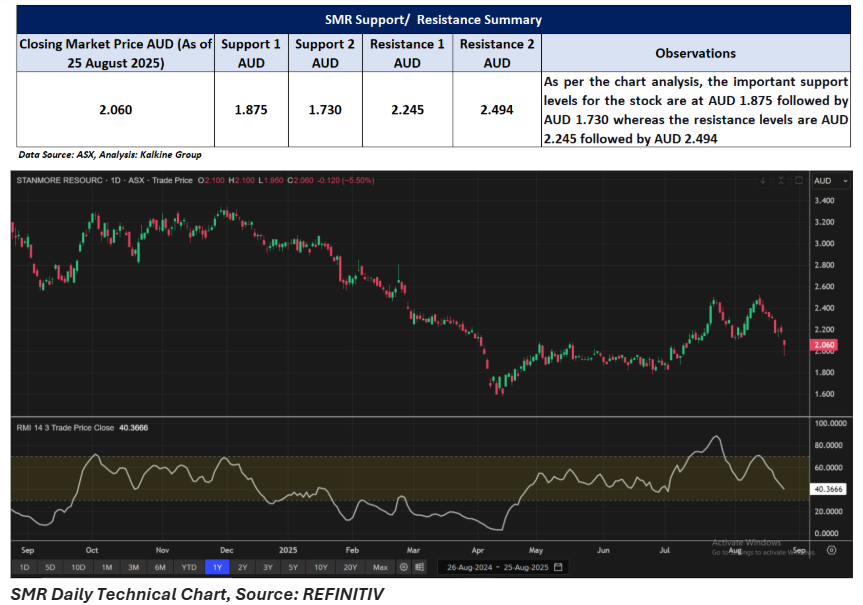
SMR shares dropped 5.50% to close at AUD 2.06 per share on 25 August 2025. In the last one year, the stock has fallen 34.19% and is down 31.56% year-to-date. It recorded a 21.97% decline over six months and a 34.19% loss over nine months. However, it gained 7.29% over three months and rose 10.16% quarter-to-date. SMR shares reached a 52-week high of AUD 3.34 on 2 December 2024 and a 52-week low of AUD 1.58 on 11 April 2025.
Support and Resistance Summary
Note 1: Past performance is neither an Indicator nor a guarantee of future performance.
Note 2: The reference date for all price data, and currency, is 25 August 2025. The reference data in this report has been partly sourced from EODHD/Others.
Technical Indicators Defined:
Support: A level at which the stock prices tend to find support if they are falling, and a downtrend may take a pause backed by demand or buying interest. Support 1 refers to the nearby support level for the stock and if the price breaches the level, then Support 2 may act as the crucial support level for the stock.
Resistance: A level at which the stock prices tend to find resistance when they are rising, and an uptrend may take a pause due to profit booking or selling interest. Resistance 1 refers to the nearby resistance level for the stock and if the price surpasses the level, then Resistance 2 may act as the crucial resistance level for the stock.
Disclaimer
This article has been prepared by Kalkine Media, echoed on the website kalkinemedia.com/au and associated pages, based on the information obtained and collated from the subscription reports prepared by Kalkine Pty. Ltd. [ABN 34 154 808 312; AFSL no. 425376] on Kalkine.com.au (and associated pages). The principal purpose of the content is to provide factual information only for educational purposes. None of the content in this article, including any news, quotes, information, data, text, reports, ratings, opinions, images, photos, graphics, graphs, charts, animations, and video is or is intended to be, advisory in nature. The content does not contain or imply any recommendation or opinion intended to influence your financial decisions, including but not limited to, in respect of any particular security, transaction, or investment strategy, and must not be relied upon by you as such. The content is provided without any express or implied warranties of any kind. Kalkine Media, and its related bodies corporate, agents, and employees (Kalkine Group) cannot and do not warrant the accuracy, completeness, timeliness, merchantability, or fitness for a particular purpose of the content or the website, and to the extent permitted by law, Kalkine Group hereby disclaims any and all such express or implied warranties. Kalkine Group shall NOT be held liable for any investment or trading losses you may incur by using the information shared on our website.
