


Highlights
- RMD’s revenue up 10% YoY and net income up 30% YoY in 4QFY25.
- RMD’s operating margin improved to 32.7% in FY25.
- FY26 focus remains on digital health expansion and enhanced healthcare collaborations.
ResMed Inc. (ASX:RMD) develops digital health technologies and cloud-connected medical devices used in the management of sleep apnea, chronic obstructive pulmonary disease (COPD), and other long-term conditions. The company distributes its products in more than 120 countries through its subsidiaries and independent distributors.
Financial Update
For the quarter ended 30 June 2025 (4QFY25), RMD has reported revenue of USD 1,348.0 million, up 10% year-on-year (YoY) compared to USD 1223.2 million in 4QFY24. Net income rose to USD 379.7 million, reflecting a 30% increase in 4QFY25 from USD 292.2 million in 4QFY24, while during the same period operating cash flow reached USD 538.7 million, a 22% rise compared with the prior corresponding period.
The results were supported by continued demand for sleep devices and masks, as well as growth in the Residential Care Software division. Gross margin improved by 230 basis points, aided by efficiencies in procurement, manufacturing, logistics, and favorable currency movements.
Business Update
On 9 October 2025, the company announced that it will release its Q1 FY26 financial and operational results on 30 October 2025, after the market closes. The announcement will be followed by a management webcast covering the results and other related updates.
Key Positives and Negatives
In FY25, the company recorded an improvement in its operating margin to 32.7%, compared with 28.2% in FY24, and its quick ratio increased to 2.53x in FY25 from 1.69x in FY24. However, the gross margin reached 59.3% in FY25, below the industry median of 64.8%, in the same period asset turnover ratio declined slightly to 0.68x from 0.69x in FY24.
Business Outlook
RMD’s begins FY26 with continued operational momentum and a focus on maintaining growth through innovation and digital expansion. The company plans to advance its digital health capabilities, strengthen collaborations with healthcare partners to improve access to care and increase patient engagement.
Ongoing investments in technology, data insights, and product development are expected to support long-term efficiency and performance.
Share Performance of RMD
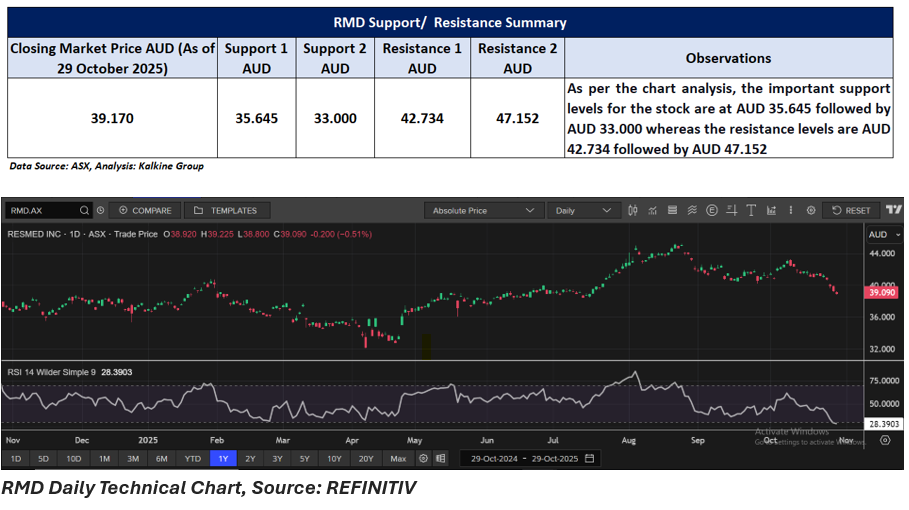
RMD shares were trading at AUD 39.090 per share on 29 October 2025 with intraday loss of 0.51%. RMD’s stock down by 7.1% in last three months, however gained 6.57% over the past six months as well as up by 3.11% over the past year. RMD’s 52 week high is AUD 45.25, recorded on 25 August 2025 and 52-week low is AUD 32.040, recorded on 07 April 2025.
Support and Resistance Summary
Note 1: Past performance is neither an Indicator nor a guarantee of future performance.
Note 2: The reference date for all price data, and currency, is 29 October 2025. The reference data in this report has been partly sourced from EODHD/Others.
Technical Indicators Defined:
Support: A level at which the stock prices tend to find support if they are falling, and a downtrend may take a pause backed by demand or buying interest. Support 1 refers to the nearby support level for the stock and if the price breaches the level, then Support 2 may act as the crucial support level for the stock.
Resistance: A level at which the stock prices tend to find resistance when they are rising, and an uptrend may take a pause due to profit booking or selling interest. Resistance 1 refers to the nearby resistance level for the stock and if the price surpasses the level, then Resistance 2 may act as the crucial resistance level for the stock.
Disclaimer
This article has been prepared by Kalkine Media, echoed on the website kalkinemedia.com/au and associated pages, based on the information obtained and collated from the subscription reports prepared by Kalkine Pty. Ltd. [ABN 34 154 808 312; AFSL no. 425376] on Kalkine.com.au (and associated pages). The principal purpose of the content is to provide factual information only for educational purposes. None of the content in this article, including any news, quotes, information, data, text, reports, ratings, opinions, images, photos, graphics, graphs, charts, animations, and video is or is intended to be, advisory in nature. The content does not contain or imply any recommendation or opinion intended to influence your financial decisions, including but not limited to, in respect of any particular security, transaction, or investment strategy, and must not be relied upon by you as such. The content is provided without any express or implied warranties of any kind. Kalkine Media, and its related bodies corporate, agents, and employees (Kalkine Group) cannot and do not warrant the accuracy, completeness, timeliness, merchantability, or fitness for a particular purpose of the content or the website, and to the extent permitted by law, Kalkine Group hereby disclaims any and all such express or implied warranties. Kalkine Group shall NOT be held liable for any investment or trading losses you may incur by using the information shared on our website.
