


Highlights
- Regal Partners’ average funds under management (FUM) rose 49% YoY to AUD 17.5 billion in 1HFY25.
- Net profit after tax (NPAT) declined 24% YoY to AUD 44.8 million in 1HFY25, despite a 65% YoY rise in management and loan management fees.
- FUM increased a further 5% in July 2025 to AUD 18.5 billion.
Regal Partners Limited (ASX:RPL), a specialist alternatives investment manager with over two decades of experience offers strategies across long/short equities, real and natural assets, private markets and credit and royalties, serving a wide client base.
In the half year ended 30 June 2025 (1HFY25), the company reported average funds under management (FUM) of AUD 17.5 billion, up 49% from AUD 11.7 billion in the prior corresponding period. Total net income remained broadly steady at AUD 148.4 million, while net profit after tax (NPAT) declined 24% YoY to AUD 44.8 million from AUD 59 million, mainly due to lower performance fees and other income. While management and loan management fees rose 65% YoY, driven by acquisitions and net inflows, lower performance fees weighed on profitability.
Recent Business Updates
On 27 August 2025, Regal Partners issued 2,839,078 fully paid ordinary shares following the conversion of unquoted rights under its employee incentive scheme. The issuance increased total quoted securities on issue to 353,289,670.
Company Outlook
Regal Partners reported a positive start to the second half of FY25, with FUM increasing 5% in July 2025 to AUD 18.5 billion. Higher inflows across hedge funds, credit, and multi-strategy platforms are expected to support continued growth, with momentum from offshore mandates and diversified client demand carrying into the remainder of the year.
International client wins in July highlighted the company’s expanding global footprint. Continued traction is expected offshore, particularly across Asia and Europe, contributing to geographic diversification and new FUM growth.
The company remains focused on expanding through acquisitions and partnerships, with a disciplined approach to deploying capital in areas aligned with long-term growth and diversification across asset classes.
Share performance of RPL
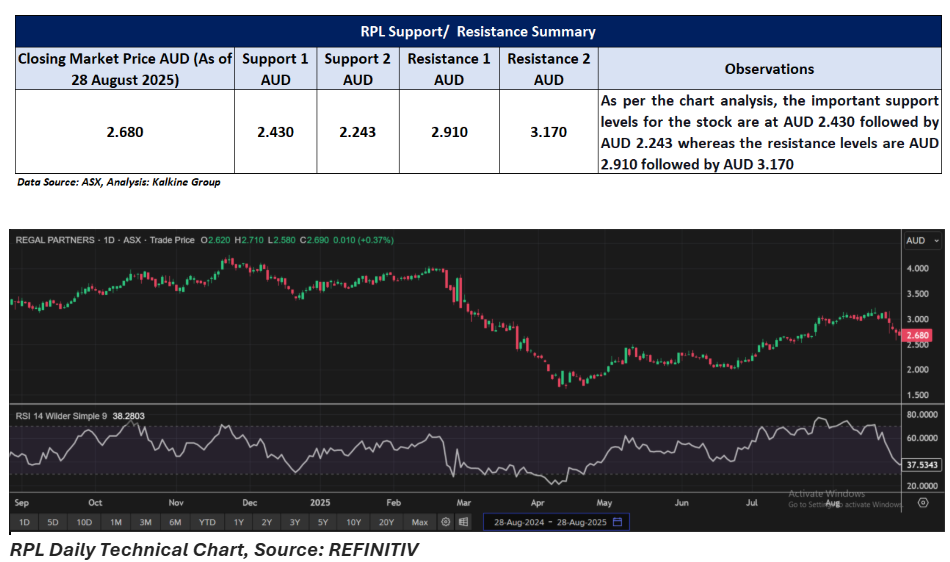
RPL shares closed at AUD 2.68 per share on 28 August 2025. In a month, RPL’s share price has dropped by almost 10% and nearly 16% in the last six months. The 52-week low of RPL is AUD 1.620 and 52-week high is AUD 4.270.
Support and Resistance Summary
Note 1: Past performance is neither an Indicator nor a guarantee of future performance.
Note 2: The reference date for all price data, and currency, is 28 August 2025. The reference data in this report has been partly sourced from EODHD/Others.
Technical Indicators Defined:
Support: A level at which the stock prices tend to find support if they are falling, and a downtrend may take a pause backed by demand or buying interest. Support 1 refers to the nearby support level for the stock and if the price breaches the level, then Support 2 may act as the crucial support level for the stock.
Resistance: A level at which the stock prices tend to find resistance when they are rising, and an uptrend may take a pause due to profit booking or selling interest. Resistance 1 refers to the nearby resistance level for the stock and if the price surpasses the level, then Resistance 2 may act as the crucial resistance level for the stock.
Disclaimer
This article has been prepared by Kalkine Media, echoed on the website kalkinemedia.com/au and associated pages, based on the information obtained and collated from the subscription reports prepared by Kalkine Pty. Ltd. [ABN 34 154 808 312; AFSL no. 425376] on Kalkine.com.au (and associated pages). The principal purpose of the content is to provide factual information only for educational purposes. None of the content in this article, including any news, quotes, information, data, text, reports, ratings, opinions, images, photos, graphics, graphs, charts, animations, and video is or is intended to be, advisory in nature. The content does not contain or imply any recommendation or opinion intended to influence your financial decisions, including but not limited to, in respect of any particular security, transaction, or investment strategy, and must not be relied upon by you as such. The content is provided without any express or implied warranties of any kind. Kalkine Media, and its related bodies corporate, agents, and employees (Kalkine Group) cannot and do not warrant the accuracy, completeness, timeliness, merchantability, or fitness for a particular purpose of the content or the website, and to the extent permitted by law, Kalkine Group hereby disclaims any and all such express or implied warranties. Kalkine Group shall NOT be held liable for any investment or trading losses you may incur by using the information shared on our website.
