


Highlights
- PGC’S revenue surged 21.7% YoY to AUD 3.61 billion in FY25, driven by pharmacy, logistics, and Asian demand.
- EBITDA of PGC almost doubled to AUD 88.5 million, reflecting operational leverage.
- Net profit surged 151% YoY to AUD 20.6 million, supported by integration synergies.
Paragon Care Limited (ASX:PGC), a diversified healthcare provider serving hospitals, aged care, veterinary, and diagnostic sectors across Australia, New Zealand, and Asia, reported growth in revenue and NPAT in the full year ended 30 June 2025 (FY25).
In FY25, the company delivered revenue of AUD 3,613.9 million, an increase of 21.7% over FY24, supported by pharmacy sales growth, contract logistics expansion, and higher demand in Asia.
Earnings before interest, tax, depreciation, and amortisation (EBITDA) for the period rose 97.5% YoY to AUD 88.5 million, while net profit after tax surged 151.2% to AUD 20.6 million. The yearly performance was underpinned by early synergy benefits from the integration of CH2, Oborne, and Paragon Care operations.
The company noted that FY24 comparisons reflected only one month of Paragon Care’s and 12 months of CH2 Holdings, whereas FY25 included a full year, amplifying the year-on-year growth trajectory.
Outlook for FY26
Paragon Care expects revenue growth in FY26 to align with FY25’s trajectory, driven by continued momentum in pharmacy, logistics, and Asian markets. Profitability is projected to improve as the company realises the full potential of merger synergies.
Strategic priorities include:
- Integration Completion: Delivering the remaining CH2 and Oborne synergies across logistics, procurement, and shared services.
- Expansion in Asia-Pacific: Scaling aesthetics, dental, and robotics segments, replicating successful models across new markets.
- M&A Pipeline: Pursuing accretive acquisitions focused on category leadership, supply chain capabilities, and regional diversification.
Share performance of PGC
Paragon Care shares gained 4.76% to close at AUD 0.330 apiece on 3 September 2025. In a year, PGC share price has fallen 25.00%. It is down 30.53% across both the six- and nine-month periods, 16.46% over three months, and 14.29% in the past month.
The 52-week high for PGC is AUD 0.590, recorded on 3 February 2025, while the 52-week low is AUD 0.315, reached on 2 September 2025.
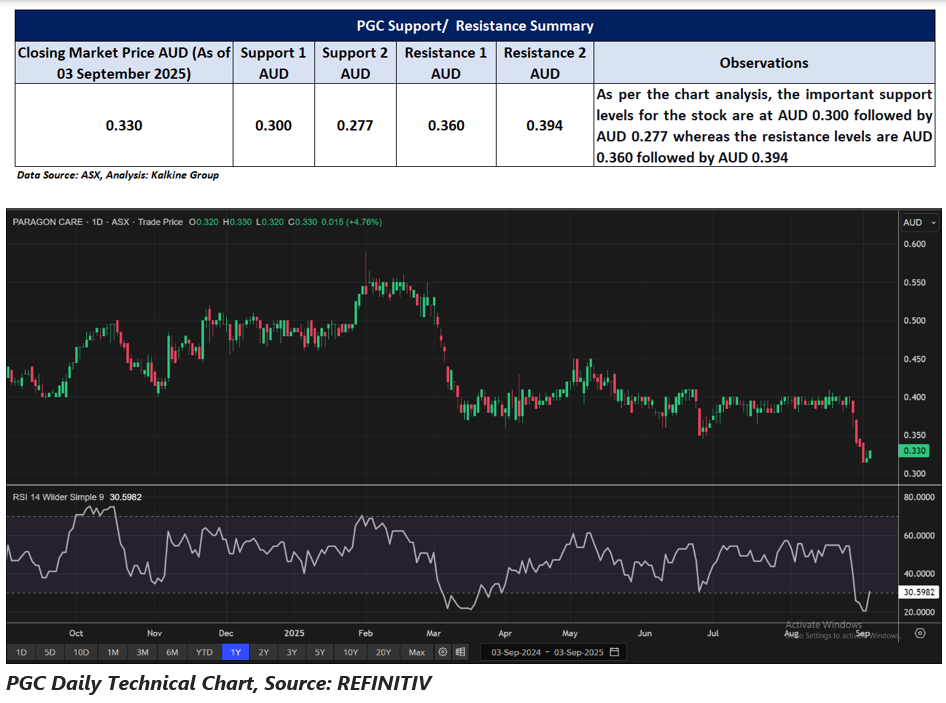
Support and Resistance Summary
Note 1: Past performance is neither an Indicator nor a guarantee of future performance.
Note 2: The reference date for all price data, and currency, is 03 September 2025. The reference data in this report has been partly sourced from EODHD/Others.
Technical Indicators Defined:
Support: A level at which the stock prices tend to find support if they are falling, and a downtrend may take a pause backed by demand or buying interest. Support 1 refers to the nearby support level for the stock and if the price breaches the level, then Support 2 may act as the crucial support level for the stock.
Resistance: A level at which the stock prices tend to find resistance when they are rising, and an uptrend may take a pause due to profit booking or selling interest. Resistance 1 refers to the nearby resistance level for the stock and if the price surpasses the level, then Resistance 2 may act as the crucial resistance level for the stock.
Disclaimer
This article has been prepared by Kalkine Media, echoed on the website kalkinemedia.com/au and associated pages, based on the information obtained and collated from the subscription reports prepared by Kalkine Pty. Ltd. [ABN 34 154 808 312; AFSL no. 425376] on Kalkine.com.au (and associated pages). The principal purpose of the content is to provide factual information only for educational purposes. None of the content in this article, including any news, quotes, information, data, text, reports, ratings, opinions, images, photos, graphics, graphs, charts, animations, and video is or is intended to be, advisory in nature. The content does not contain or imply any recommendation or opinion intended to influence your financial decisions, including but not limited to, in respect of any particular security, transaction, or investment strategy, and must not be relied upon by you as such. The content is provided without any express or implied warranties of any kind. Kalkine Media, and its related bodies corporate, agents, and employees (Kalkine Group) cannot and do not warrant the accuracy, completeness, timeliness, merchantability, or fitness for a particular purpose of the content or the website, and to the extent permitted by law, Kalkine Group hereby disclaims any and all such express or implied warranties. Kalkine Group shall NOT be held liable for any investment or trading losses you may incur by using the information shared on our website.
