


Highlights
- PGC aims AUD 12 million net synergies in FY26. s.
- The company achieved an underlying EBITDA of AUD 95.2 million for FY25.
- In FY25, pharmacy sales grew 11.6%, while total retail pharmacy sales increased 23.4% year-on-year.
Paragon Care Limited (ASX:PGC) is an Australian healthcare company that supplies medical equipment, devices, consumables, and pharmaceuticals. The company operates across hospitals, aged care, veterinary, and diagnostic sectors in Australia, New Zealand, and Asia.
Financial Updated
In the financial year 2025 (FY25), PGC has reported revenue of AUD 3,613.9 million, a 21.7% increase from AUD 2,969.9 million in FY24. The company achieved an underlying EBITDA of AUD 95.2 million in FY25, covering the first full year of operations for Paragon Care, Oborne, and CH2. During the same period pharmacy sales grew 11.6% YoY, supporting regional performance, while total retail pharmacy sales, including Contract Logistics, increased 23.4%. Year-end cash stood at AUD 20.3 million in FY25, up by 2.0% from AUD 19.9 million in FY24. Net profit after tax rose to AUD 20.6 million in FY25, up 151.2% from AUD 8.2 million in the prior year.
Business Updated
On 15 October 2025, PGC announced that Mr. Marcus Crowe resigned as Chief Financial Officer (CFO) to pursue other opportunities, effective immediately. The company has begun a formal search for a successor and will provide updates when available.
Key Positives and Negatives
In FY25, the company increased its EBITDA margin, rising to 2.4% from 1.5% in FY24, and an improvement in its quick ratio to 0.74x in FY25 from 0.58x in FY24. On the other hand, during the same period company’s current ratio declined to 1.17x, below the industry median of 1.36x, and the cash conversion cycle increased to 68.8 days in FY25 from 42.9 days in FY25.
Business Outlook
The integration of Oborne has enhanced the company’s position in the complementary medicines market, achieving AUD 105 million in sales in FY25. The company plans to grow its medical consumables range, including private-label products, and expand its new Dental Division. PGC delivered AUD 5 million in net synergies in FY25 and aims to reach AUD 12 million in FY26.
Integration across Australia and New Zealand remains a focus before considering expansion into Asia. Operational efficiency is supported by cost rationalisation, a LEAN operating model, and investments in systems and data analytics. Revenue is expected to maintain FY25 growth trends, with profitability improving as synergies are realised, and the Board will continue reviewing the dividend policy in FY26.
Share Performance
PGC shares traded at AUD 0.295 per share on 22 October 2025, with an intraday loss of 3.28%. It is down 23.37% in the last three months and 26.24% in the last six months, as well as 33.70% down in the last one year. PGC’s 52-week high is AUD 0.590, recorded on 03 February 2025, and the 52-week low is AUD 0.240, recorded on 16 October 2025.
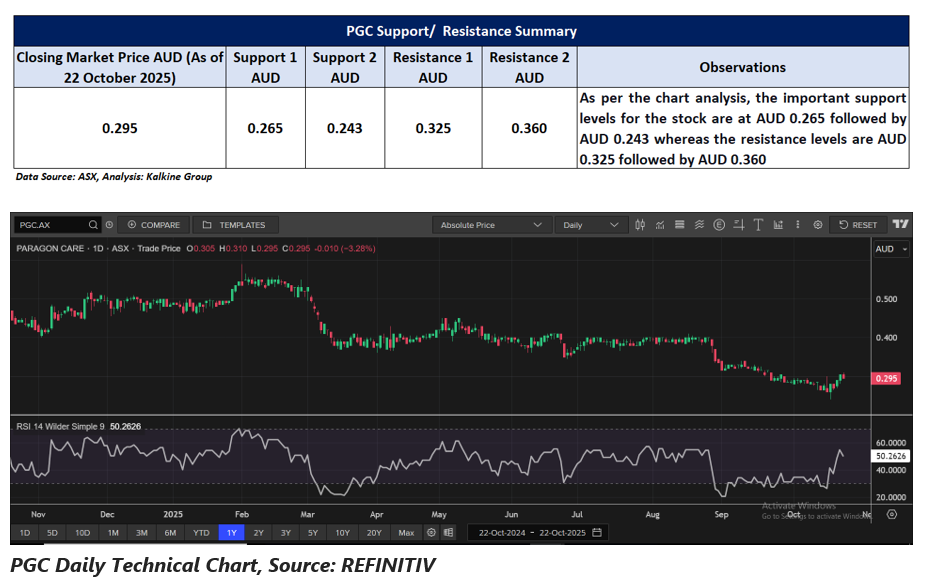
Support and Resistance Summary
Note 1: Past performance is neither an Indicator nor a guarantee of future performance.
Note 2: The reference date for all price data, and currency, is 22 October 2025. The reference data in this report has been partly sourced from EODHD/Others.
Technical Indicators Defined:
Support: A level at which the stock prices tend to find support if they are falling, and a downtrend may take a pause backed by demand or buying interest. Support 1 refers to the nearby support level for the stock and if the price breaches the level, then Support 2 may act as the crucial support level for the stock.
Resistance: A level at which the stock prices tend to find resistance when they are rising, and an uptrend may take a pause due to profit booking or selling interest. Resistance 1 refers to the nearby resistance level for the stock and if the price surpasses the level, then Resistance 2 may act as the crucial resistance level for the stock.
Disclaimer
This article has been prepared by Kalkine Media, echoed on the website kalkinemedia.com/au and associated pages, based on the information obtained and collated from the subscription reports prepared by Kalkine Pty. Ltd. [ABN 34 154 808 312; AFSL no. 425376] on Kalkine.com.au (and associated pages). The principal purpose of the content is to provide factual information only for educational purposes. None of the content in this article, including any news, quotes, information, data, text, reports, ratings, opinions, images, photos, graphics, graphs, charts, animations, and video is or is intended to be, advisory in nature. The content does not contain or imply any recommendation or opinion intended to influence your financial decisions, including but not limited to, in respect of any particular security, transaction, or investment strategy, and must not be relied upon by you as such. The content is provided without any express or implied warranties of any kind. Kalkine Media, and its related bodies corporate, agents, and employees (Kalkine Group) cannot and do not warrant the accuracy, completeness, timeliness, merchantability, or fitness for a particular purpose of the content or the website, and to the extent permitted by law, Kalkine Group hereby disclaims any and all such express or implied warranties. Kalkine Group shall NOT be held liable for any investment or trading losses you may incur by using the information shared on our website.
