


Highlights
- NST recorded a 28% YoY increase in revenue and 142% YoY rise in NPAT in 1HFY25.
- The KCGM Mill Expansion and proposed De Grey Mining acquisition is expected to improve gold portfolio of NST.
- The company expects gold sales of 1,650-1,800 koz with an AISC of AUD 1.850-2,100 per ounce in FY25
Northern Star Resources Ltd (ASX:NST) is an international gold production company that is progressing with its key projects, including the KCGM Mill Expansion, which remains on schedule and within budget. This initiative is expected to drive long-term production growth. In parallel, NST is expanding its gold reserves through exploration and acquisitions.
Furthermore, the company is advancing with the acquisition of De Grey Mining Ltd, which aims to enhance NST’s gold portfolio with high-quality assets.
On 11 March 2025, NST provided an update on its proposed acquisition of De Grey Mining. As part of the acquisition process, the Federal Court has mandated De Grey to hold a Scheme Meeting, where shareholders will vote on the resolution. Additionally, the Scheme Booklet, which outlines the details of the transaction, has been approved for distribution to shareholders and registered with the Australian Securities and Investments Commission (ASIC).
Financial Performance in 1HFY25
In the half-year ended 31 December 2024 (1HFY25), the company reported a 28% YoY increase in revenue to AUD 2,869 million, primarily driven by higher average realised gold prices. Net profit after tax (NPAT) in 1HFY25 surged by 142% YoY to AUD 512 million, while operating cash flow rose by 49% YoY to AUD 1,254 million. The volume of gold sold increased to 804,140 ounces, up from 780,785 ounces in the previous period. Additionally, NST declared a record interim dividend of 25.0 cents per share.
Optimistic Outlook for FY25
NST expects gold sales of 1,650 – 1,800 koz, with an all-in sustaining cost (AISC) ranging between AUD 1,850 – 2,100 per ounce. Meanwhile, growth capital expenditure is projected at AUD 950 – 1,020 million, along with an additional AUD 500 – 530 million for the KCGM Mill Expansion Project.
NST’s Pogo operation is set to reach 1.4 million tonnes per annum (Mtpa) throughput, while additional production growth is expected at Yandal and Kalgoorlie operations in the second half of FY25.
Share performance of NST
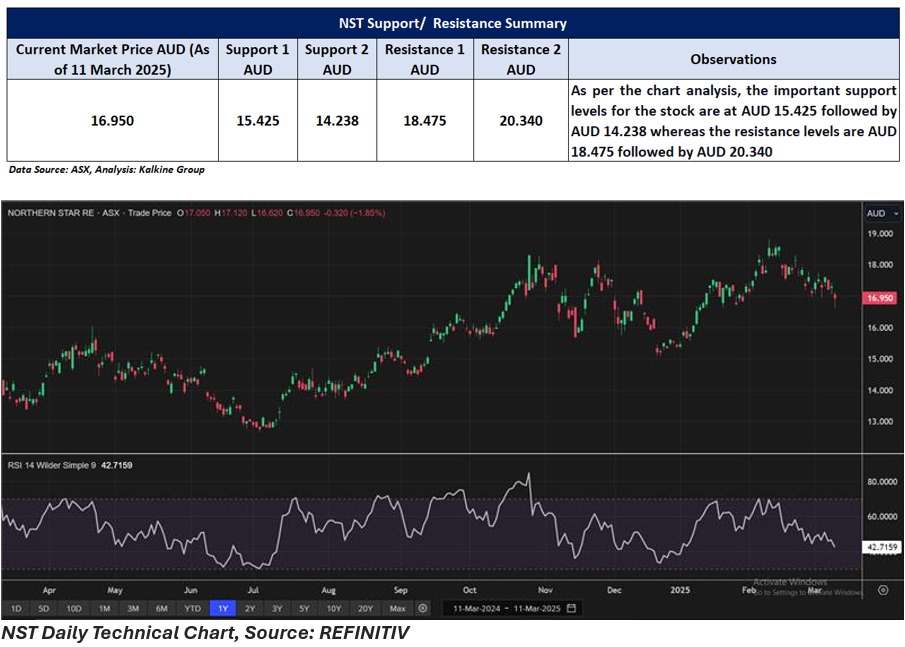
NST shares closed 1.85% lower at AUD 16.95 per share on 11 March 2025. Over the past year, NST’s share price has increased by nearly 22.38% and in the past six months, it has recorded a rise of 16.10%.
52-week high of NST is AUD 18.805, recorded on 11 February 2025 and 52-week low is AUD 12.65, recorded on 3 July 2024.
Support and Resistance Summary
Note 1: Past performance is neither an Indicator nor a guarantee of future performance.
Note 2: The reference date for all price data, and currency, is 11 March 2025. The reference data in this report has been partly sourced from EODHD/Others.
Technical Indicators Defined:
Support: A level at which the stock prices tend to find support if they are falling, and a downtrend may take a pause backed by demand or buying interest. Support 1 refers to the nearby support level for the stock and if the price breaches the level, then Support 2 may act as the crucial support level for the stock.
Resistance: A level at which the stock prices tend to find resistance when they are rising, and an uptrend may take a pause due to profit booking or selling interest. Resistance 1 refers to the nearby resistance level for the stock and if the price surpasses the level, then Resistance 2 may act as the crucial resistance level for the stock.
Disclaimer
This article has been prepared by Kalkine Media, echoed on the website kalkinemedia.com/au and associated pages, based on the information obtained and collated from the subscription reports prepared by Kalkine Pty. Ltd. [ABN 34 154 808 312; AFSL no. 425376] on Kalkine.com.au (and associated pages). The principal purpose of the content is to provide factual information only for educational purposes. None of the content in this article, including any news, quotes, information, data, text, reports, ratings, opinions, images, photos, graphics, graphs, charts, animations, and video is or is intended to be, advisory in nature. The content does not contain or imply any recommendation or opinion intended to influence your financial decisions, including but not limited to, in respect of any particular security, transaction, or investment strategy, and must not be relied upon by you as such. The content is provided without any express or implied warranties of any kind. Kalkine Media, and its related bodies corporate, agents, and employees (Kalkine Group) cannot and do not warrant the accuracy, completeness, timeliness, merchantability, or fitness for a particular purpose of the content or the website, and to the extent permitted by law, Kalkine Group hereby disclaims any and all such express or implied warranties. Kalkine Group shall NOT be held liable for any investment or trading losses you may incur by using the information shared on our website.
