_12_03_2025_11_00_46_510615.png)


Highlights
- MLG Oz reported a 15.47% rise in FY25 revenue to AUD 548.30 million.
- Net debt reduced by approximately AUD 20 million over six months, with gearing declining to 0.88x.
- MLG expects further revenue growth and margin improvement in FY26.
MLG Oz Limited (ASX:MLG), a Kalgoorlie-headquartered mining services and resource asset management company, delivered an improved financial performance for the year ended 30 June 2025 (FY25). The company provides crushing, screening, haulage and site services to ore processing operations across gold, iron ore and base metals in Western Australia and the Northern Territory, benefited from the ramp-up of several major contracts in the second half of the financial year.
FY25 Financial Performance
MLG reported AUD 548.30 million in revenue in FY25, a 15.47% increase from AUD 474.85 million in FY24. Profit before income tax reached AUD 18.17 million, compared with AUD 16.30 million the previous year, reflecting 11.45% YoY increase. Basic earnings per share improved from AUD 0.07 to AUD 0.08 in FY25.
During the reported period, MLG recorded 10% YoY increase in NPAT, which reached AUD 12.1 million, underpinned by the mobilisation of new contracts with Northern Star, Westgold, Rio Tinto and Fortescue.
In FY25, MLG’s gearing reduced to 0.88x, and net debt declined by approximately AUD 20 million between December 2024 and June 2025. The company chose not to declare a dividend, opting instead to retain capital for expansion initiatives and future project commitments.
FY26 Outlook
The company enters FY26 with what it describes as favourable momentum. MLG anticipates another year of revenue growth supported by high levels of activity from its core gold-sector clients amid historically high gold prices. Additional upside is expected from expanded iron ore haulage operations and a full-year contribution from several major contracts secured in FY25.
Projects with Rio Tinto, Fortescue and New Murchison Gold are expected to help stabilise crushing and screening volumes and lift fleet utilisation. The company is also assessing new profit-share opportunities that may offer future earnings contributions once finalised.
Overall, MLG’s guidance indicates a growth-oriented FY26 with scope for incremental margin improvement, backed by high client demand and recently mobilised long-term contracts.
Key Positives and Challenges
MLG achieved 15.90% YoY EBIT growth in FY25 and reduced gearing by 37.1% YoY. Meanwhile, net margin reached 2.9% in FY25, compared with an industry median of 14.1%, and EBITDA margin stood at 13.4%, below the industry median of 31.9%.
Share Performance of MLG
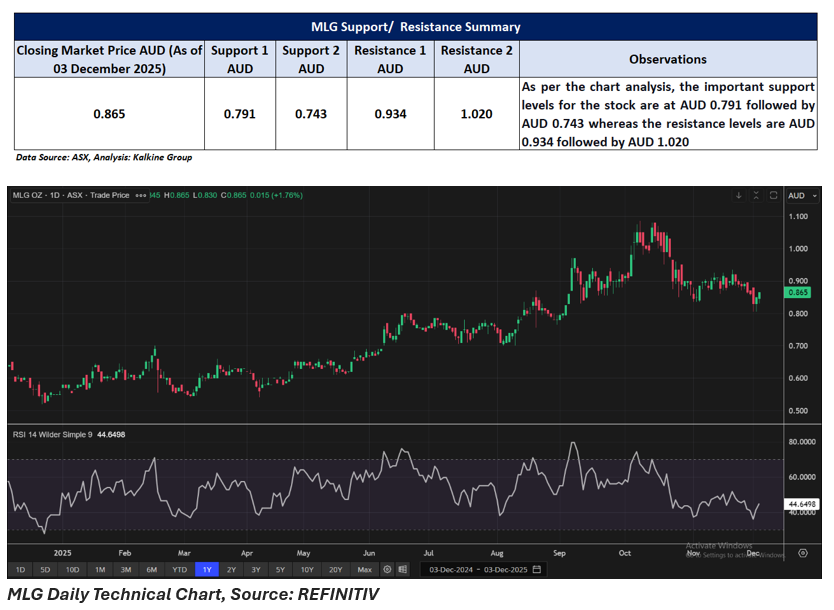
MLG shares ended the session at AUD 0.865 per share on 03 December 2025, rising 1.76%. Over the past year, the stock has gained 35.16%. It is up 4.85% over the three-month period and has increased 2.37% in the past month. MLG also rose 1.76% during the past week and posted a 29.10% gain over six months.
The 52-week high for MLG is AUD 1.085, recorded on 8 October 2025, and the 52-week low is AUD 0.520, reached on 18 December 2024.
Support and Resistance Summary
Note 1: Past performance is neither an Indicator nor a guarantee of future performance.
Note 2: The reference date for all price data, and currency, is 03 December 2025. The reference data in this report has been partly sourced from EODHD/Others.
Technical Indicators Defined:
Support: A level at which the stock prices tend to find support if they are falling, and a downtrend may take a pause backed by demand or buying interest. Support 1 refers to the nearby support level for the stock and if the price breaches the level, then Support 2 may act as the crucial support level for the stock.
Resistance: A level at which the stock prices tend to find resistance when they are rising, and an uptrend may take a pause due to profit booking or selling interest. Resistance 1 refers to the nearby resistance level for the stock and if the price surpasses the level, then Resistance 2 may act as the crucial resistance level for the stock.
Disclaimer
This article has been prepared by Kalkine Media, echoed on the website kalkinemedia.com/au and associated pages, based on the information obtained and collated from the subscription reports prepared by Kalkine Pty. Ltd. [ABN 34 154 808 312; AFSL no. 425376] on Kalkine.com.au (and associated pages). The principal purpose of the content is to provide factual information only for educational purposes. None of the content in this article, including any news, quotes, information, data, text, reports, ratings, opinions, images, photos, graphics, graphs, charts, animations, and video is or is intended to be, advisory in nature. The content does not contain or imply any recommendation or opinion intended to influence your financial decisions, including but not limited to, in respect of any particular security, transaction, or investment strategy, and must not be relied upon by you as such. The content is provided without any express or implied warranties of any kind. Kalkine Media, and its related bodies corporate, agents, and employees (Kalkine Group) cannot and do not warrant the accuracy, completeness, timeliness, merchantability, or fitness for a particular purpose of the content or the website, and to the extent permitted by law, Kalkine Group hereby disclaims any and all such express or implied warranties. Kalkine Group shall NOT be held liable for any investment or trading losses you may incur by using the information shared on our website.
