


Highlights
- Fenix advanced construction at its third mine, Beebyn-W11, with production expected to begin in Q1 FY26, adding 1.5 Mtpa and supporting its 4 Mtpa target.
- The company intends to acquire CZR Resources in a deal valued up to AUD 71 million, boosting its iron ore asset base.
- The company shipped a record 704,000 wmt of iron ore in Q3 FY25, achieving cost efficiencies at Iron Ridge and Shine.
Fenix Resources Ltd (ASX:FEX) is a fully integrated mining, logistics, and port services company operating in Western Australia’s Mid-West region. Fenix's third mine, Beebyn-W11, has emerged as a cornerstone in the company’s growth plans. Following the completion of mining and heritage approvals in early 2025, the company awarded a mining contract to MACA and commenced construction activities, including a dedicated 17.6 km private haul road to link operations with its Iron Ridge site. With production expected to commence in the September 2025 quarter, Beebyn-W11 is forecast to contribute an additional 1.5 million tonnes per annum (Mtpa), helping Fenix meet its targeted 4 Mtpa production rate.
FEX Performance in March Quarter
During the third quarter of the financial year 2025 (Q3 FY25), Fenix shipped a record 704,000 wet metric tonnes (wmt) of iron ore, achieving notable cost reductions at both Iron Ridge and Shine operations, which recorded respective cash costs of AUD 73.8/wmt and AUD 77.9/wmt.
The company ended the quarter with a cash reserve of AUD 54.9 million and an operational cash flow of AUD 26.3 million. Capital expenditure during the period stood at AUD 9.7 million, primarily invested in logistics fleet upgrades and infrastructure development.
Strategic Expansion Through CZR Resources Acquisition
In April 2025, the company entered into a binding agreement to acquire 100% of ASX-listed CZR via an all-scrip, off-market takeover offer. Valued at approximately AUD 71 million, the deal represents an implied premium of 27–53% depending on acceptance levels. The acquisition is set to significantly enhance Fenix’s resource base, especially through CZR’s Robe Mesa project in the Pilbara region—a high-quality iron ore asset.
FEX Performance in H1 FY25
In H1 FY25, total ore sales increased by 33.11% YoY to 939.5k wmt compared to the same period in FY24. Revenue saw a 3.18% YoY uplift, reaching AUD130.97 million. While profit before tax declined by almost 89% due to one-off items and rising capital expenditures, the company reported 3.18% YoY growth in revenue to AUD 130.97 million.
The December 2024 acquisition of the Beebyn North and Beebyn Hills exploration tenements further consolidated Fenix’s presence in the Mid-West, augmenting its regional landholding.
Share performance of FEX
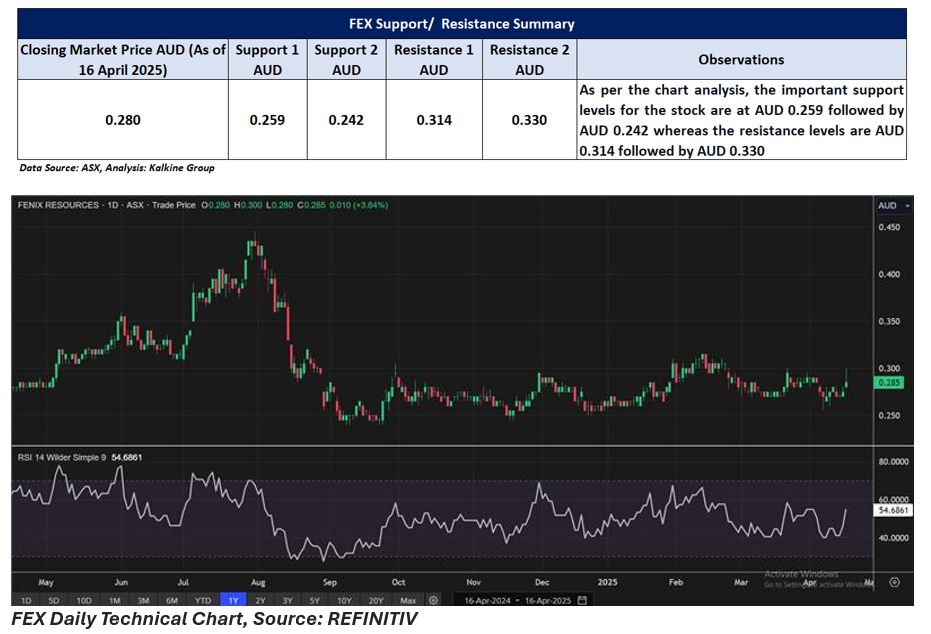
FEX shares rose 3.64% to close at AUD 0.285 on 16 April 2025. The stock has gained 1.79% over the past year and is up 7.55% year-to-date. It reached a 52-week high of AUD 0.445 on 31 July 2024 and saw a 52-week low of AUD 0.240 on 24 September 2024.
Support and Resistance Summar
Note 1: Past performance is neither an Indicator nor a guarantee of future performance.
Note 2: The reference date for all price data, and currency, is 16 April 2025. The reference data in this report has been partly sourced from EODHD/Others.
Technical Indicators Defined:
Support: A level at which the stock prices tend to find support if they are falling, and a downtrend may take a pause backed by demand or buying interest. Support 1 refers to the nearby support level for the stock and if the price breaches the level, then Support 2 may act as the crucial support level for the stock.
Resistance: A level at which the stock prices tend to find resistance when they are rising, and an uptrend may take a pause due to profit booking or selling interest. Resistance 1 refers to the nearby resistance level for the stock and if the price surpasses the level, then Resistance 2 may act as the crucial resistance level for the stock.
Disclaimer
This article has been prepared by Kalkine Media, echoed on the website kalkinemedia.com/au and associated pages, based on the information obtained and collated from the subscription reports prepared by Kalkine Pty. Ltd. [ABN 34 154 808 312; AFSL no. 425376] on Kalkine.com.au (and associated pages). The principal purpose of the content is to provide factual information only for educational purposes. None of the content in this article, including any news, quotes, information, data, text, reports, ratings, opinions, images, photos, graphics, graphs, charts, animations, and video is or is intended to be, advisory in nature. The content does not contain or imply any recommendation or opinion intended to influence your financial decisions, including but not limited to, in respect of any particular security, transaction, or investment strategy, and must not be relied upon by you as such. The content is provided without any express or implied warranties of any kind. Kalkine Media, and its related bodies corporate, agents, and employees (Kalkine Group) cannot and do not warrant the accuracy, completeness, timeliness, merchantability, or fitness for a particular purpose of the content or the website, and to the extent permitted by law, Kalkine Group hereby disclaims any and all such express or implied warranties. Kalkine Group shall NOT be held liable for any investment or trading losses you may incur by using the information shared on our website.
