_09_18_2025_16_31_14_779901.png)


Highlights
- Dalrymple Bay Infrastructure reported a 17.1% increase in statutory net profit after tax to AUD 43.1 million in H1 FY25.
- Recently, UBS Group AG and its related entities became substantial holders of DBI with 5.01% voting rights.
- DBI maintained an investment-grade balance sheet, while advancing AUD 405.5 million into NECAP projects to support future growth.
Dalrymple Bay Infrastructure (ASX:DBI), an ASX-listed infrastructure company, operates the Dalrymple Bay Terminal (DBT), providing infrastructure and services for Australian coal exports. The company reported total income (excluding interest income) of AUD 395.4mn in the first half of the financial year 2025 (H1 FY25), compared to AUD 366.5mn in 1HFY24, up 7.9%.
Fund From Operations (FFO) reached AUD 84.1mn in 1HFY25 vs AUD 73.9mn in 1HFY24, up 13.8%, and statutory net profit after tax stood at AUD 43.1mn in 1HFY25 vs AUD 36.8mn in 1HFY24, up 17.1%.
During the reported period, DBI reported Terminal Infrastructure Charge (TIC) revenue of AUD 151.1mn (+4.2% YoY), meanwhile, EBITDA increased 5.3%, NPAT jumped 17.1% YoY, and FFO up 13.8%, supported by an investment-grade balance sheet. Borrowings stood at AUD 1,724.2mn, with AUD 405.5mn allocated to NECAP projects
Business Updates
Through an ASX update dated 15 September 2025, the company informed that UBS Group AG and its related corporate bodies became substantial holders of DBI, securing 5.01% voting rights in the company.
Key Positives and Negative
In 1HFY25, the company reported improvement in asset turnover to 0.12x from 0.09x in the prior year period and return on equity rising to 4.0% compared with 3.3% in 1HFY24. However, the EBITDA margin eased to 36.4% from 37.2%, while the debt-to-equity ratio remained significantly higher at 1.80x versus the industry median of 0.28x.
Business Outlook
DBI aims to drive organic revenue growth through new initiatives and the rollout of approved NECAP projects. The company will continue to assess terminal capacity utilisation to support long-term demand from Bowen Basin metallurgical coal producers, including evaluating the 8X project.
The company focuses on maintaining investment grade credit rating and evaluating alternative future uses of the DBI.
Share Performance of DBI
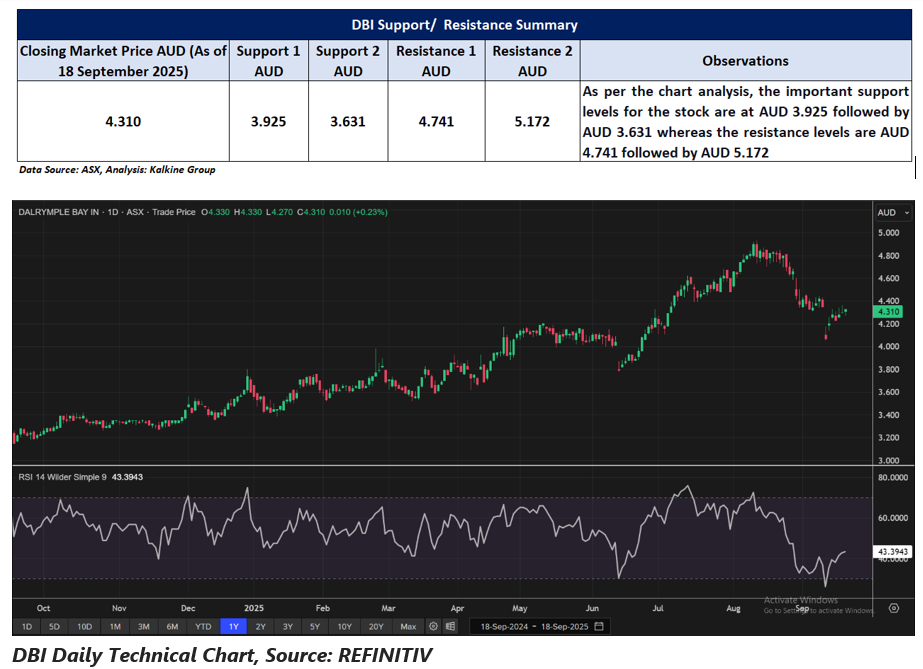
DBI shares closed at AUD 4.310 per share on 18 September 2025, marking a intraday gain of 0.23%. In one year, the stock has advanced 36.83%, while it is up 18.41% in the past six months and 23.50% over the past nine months. In the shorter term, DBI gained 2.62% over the past week and 11.08% across three months, though it fell 10.58% over the past month.
The company’s 52-week high stands at AUD 4.930, reached on 12 August 2025, while the 52-week low of AUD 3.150 was recorded on 18 September 2024.
Support and Resistance Summary
Note 1: Past performance is neither an Indicator nor a guarantee of future performance.
Note 2: The reference date for all price data, and currency, is 18 September 2025. The reference data in this report has been partly sourced from EODHD/Others.
Technical Indicators Defined:
Support: A level at which the stock prices tend to find support if they fall, and a downtrend may take a pause backed by demand or buying interest. Support 1 refers to the nearby support level for the stock and if the price breaches the level, then Support 2 may act as the crucial support level for the stock.
Resistance: A level at which stock prices tend to find resistance when they are rising, and an uptrend may take a pause due to profit booking or selling interest. Resistance 1 refers to the nearby resistance level for the stock and if the price surpasses the level, then Resistance 2 may act as the crucial resistance level for the stock.
