


Highlights
- ALX reported a 6.9% increase in weighted average toll revenue in FY23.
- WOR's 1HFY24 revenue surged by 22% year-over-year.
- WOR aims for 75% revenue from sustainability projects by FY26.
Dividend stocks provide reliable income to investors, offering stability and a hedge against market volatility. They signify a company's financial health and commitment to shareholders. This article explores two dividend stocks listed on the ASX.
Atlas Arteria Limited (ASX: ALX)
ALX has a global operation specialising in toll roads. The company commands a market capitalisation of AUD 7.47 billion, as of 3 July 2024. Offering investors an annual dividend yield of 7.76%, ALX distributes dividends semi-annually.
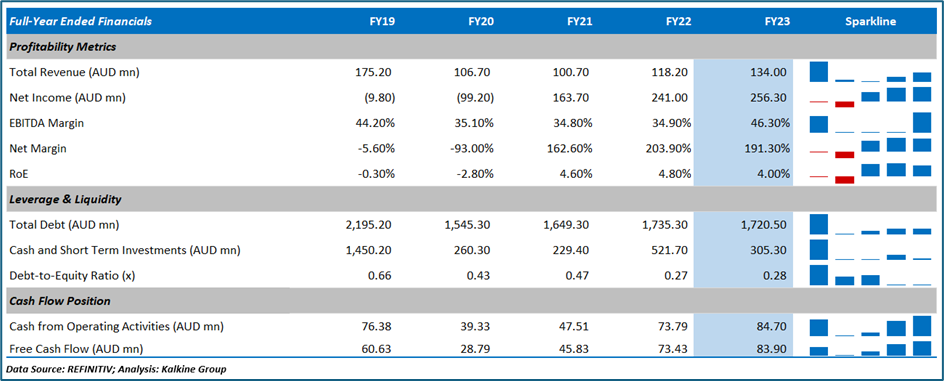
In FY23, ALX achieved a 6.9% year-over-year increase in weighted average toll revenue and a 7.1% year-over-year increase in weighted average EBITDA. Additionally, the company reported a fixed asset turnover ratio of 8.79x for FY23, significantly surpassing the industry median of 0.93x.
Historical financial trend
Recent business update - ALX recently announced agreements with co-investors in APRR Group, achieving several key outcomes:
- Refinancing the Financière Eiffarie debt facility in H1 2025 with reduced amortisation
- Releasing €200 million for debt payments in H2 2024
- Increasing Eiffage's equity in MAF2 by €55.5 million, slightly diluting Atlas Arteria's economic interest in APRR Group to 30.82%.
Outlook – The company expects a dividend distribution of 40 cents per share in FY24.
Stock performance – The stock price of ALX has tumbled by around 5.04% in the past month whereas, it has declined by around 11.48% in the past six months.
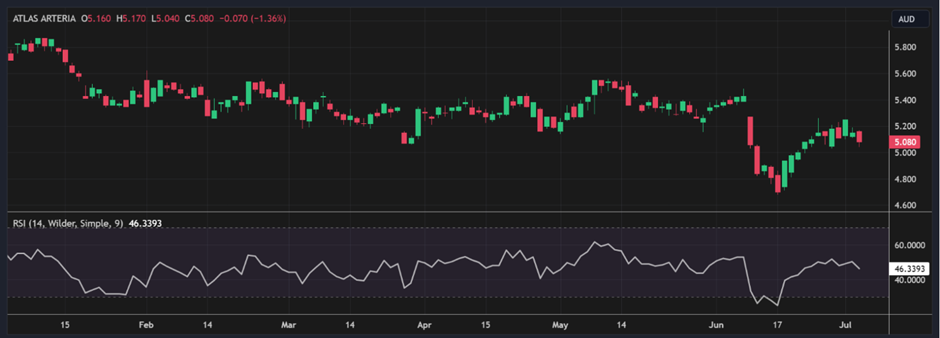
ALX Daily Technical Chart (Data source: EODHD/Others, as of 03 July 2024)
Worley Limited (ASX: WOR)
Worley is engaged in providing engineering design and project delivery services, catering to the energy, chemicals, and resources sectors. The company has a market cap of AUD 7.79 billion, as of 3 July 2024. Its annual dividend yield stands at 3.38% and it pays dividends on a semi-annual basis.
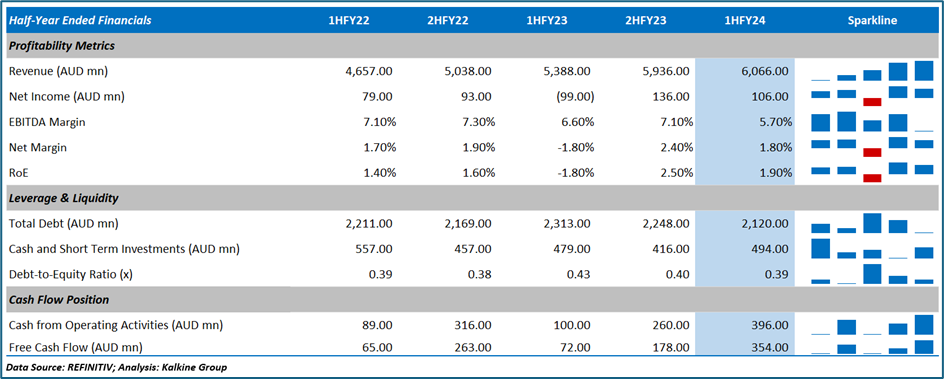
In 1HFY24, WOR’s aggregated revenue surged by around 22% compared to pcp. Similarly, underlying EBITDA surged by 28%, mainly due to higher professional services revenue, a diverse project mix, and rate improvements.
Historical financial trend
Recent business update- In May, Worley announced a strategic alliance agreement and a 20-year license agreement with Nano One Materials Corporation (TSX:NANO). The agreements aim to develop, market, license, and deploy cathode active material production facilities.
Outlook – WOR projects aggregated underlying EBITA margin for FY24 to range between 7.5% and 8%. Additionally, the company targets that 75% of its total revenue will come from sustainability-related projects by the conclusion of FY26.
Stock performance – The stock price of WOR has dipped by around 0.62% in the past month whereas, it has tumbled by around 14.62% in the past six months.
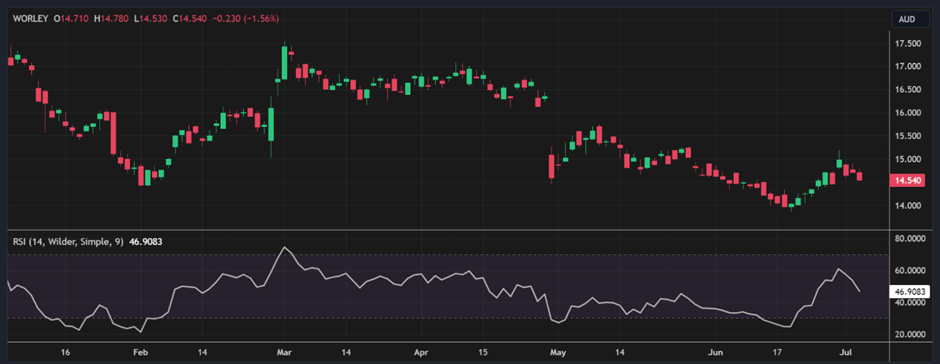
WOR Daily Technical Chart (Data source: EODHD/Others as of 03 July 2024)
Note 1: Past performance is neither an Indicator nor a guarantee of future performance.
Note 2: The reference date for all price data, and currency, is 3 July 2024. The reference data in this report has been partly sourced from EODHD/Others.
Disclaimer
This article has been prepared by Kalkine Media, echoed on the website kalkinemedia.com/au and associated pages, based on the information obtained and collated from the subscription reports prepared by Kalkine Pty. Ltd. [ABN 34 154 808 312; AFSL no. 425376] on Kalkine.com.au (and associated pages). The principal purpose of the content is to provide factual information only for educational purposes. None of the content in this article, including any news, quotes, information, data, text, reports, ratings, opinions, images, photos, graphics, graphs, charts, animations, and video is or is intended to be, advisory in nature. The content does not contain or imply any recommendation or opinion intended to influence your financial decisions, including but not limited to, in respect of any particular security, transaction, or investment strategy, and must not be relied upon by you as such. The content is provided without any express or implied warranties of any kind. Kalkine Media, and its related bodies corporate, agents, and employees (Kalkine Group) cannot and do not warrant the accuracy, completeness, timeliness, merchantability, or fitness for a particular purpose of the content or the website, and to the extent permitted by law, Kalkine Group hereby disclaims any and all such express or implied warranties. Kalkine Group shall NOT be held liable for any investment or trading losses you may incur by using the information shared on our website.
