


Typically, investors are inclined towards fundamental analysis, looking at the financial performance of the company and analysing the underlying business before making an investment decision. However, there is also another approach to consider while making a buy/sell decision, it involves studying the price action of a stock, this method is popularly known as technical analysis which primarily involves analysing the stockâs historical price chart. Letâs consider three stocks for technical analysis.
National Australia Bank Limited (ASX: NAB) is one of the largest banking institutions in Australia. The company is 160 years old with 30,000 employees and provides financial services to over 9 million customers.
On 24th December 2018, the stock had made its 52-week low of A$22.52. On the weekly chart, the Relative Strength Indicator (RSI) had already depicted an oversold condition (depicting the value of 28.75) one week before the stock hit 52-week low. In the next week, the stock made a bullish engulfing candlestick pattern which is considered as a bullish signal for a potential uptrend. Both aspects mentioned above resulted in an upward rally which is still in the continuation.
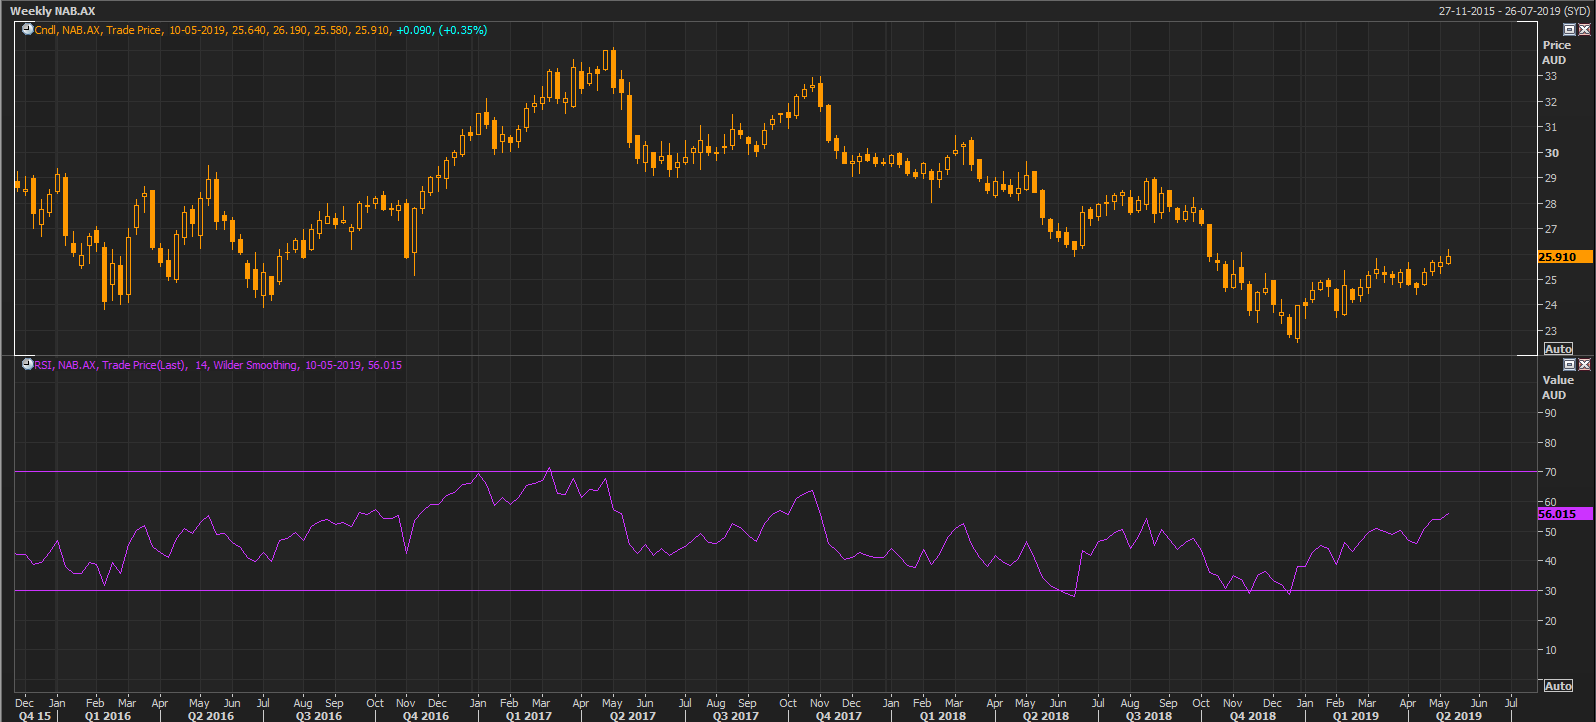 Source: Thomson Reuters NAB Weekly Chart
Currently, the stock is trading at A$25.910 as of 9th May 2019. It is trading near a strong resistance at A$26.00.
Commonwealth Bank of Australia (ASX: CBA) is a multinational bank based in Australia with business across the globe including Asia, UK, US etc. It provides services like retail banking, institutional banking, wealth management, financial planning etc.
We have witnessed a straight rally in the stock after making a swing low A$69.72 on 9th April 2019. After this swing low on the daily chart, the stock rallied all the way to A$75.86 (more than 8.5%). Since then the stock has been consolidating in a range of A$75.86 - A$74.15. This combined price action has resulted in a specific chart pattern; The bullish flag pattern. This is a continuation chart pattern and is generally expected to continue the previous bullish trend.
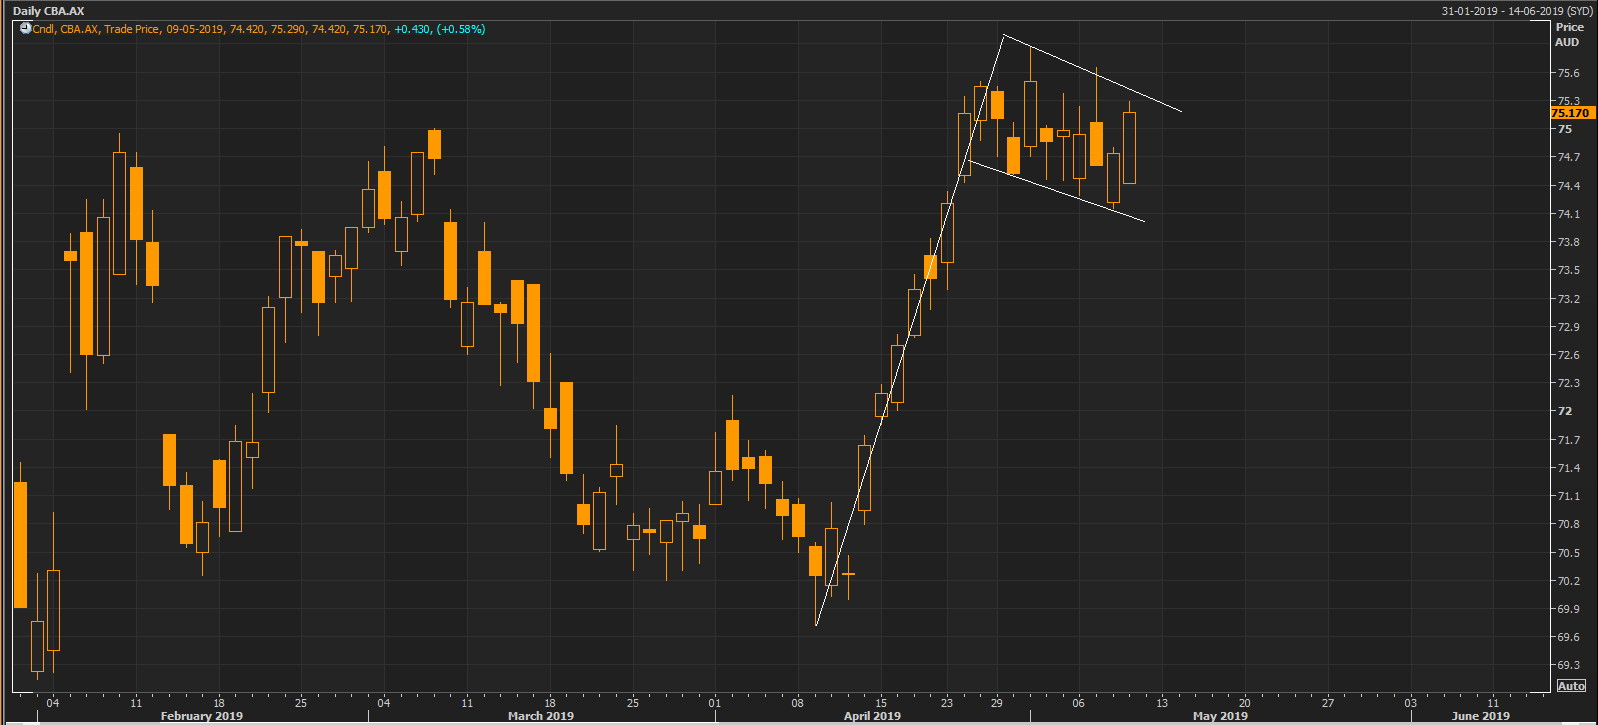 Source: Thomson Reuters CBA Daily Chart
Currently, the stock is trading at A$75.17 as of 9th May 2019. Closing above the resistance of A$75.65 would confirm the breakout of the pattern.
Telstra Corporation Limited (ASX: TLS) is an ASX listed telecommunications company based in Melbourne, Australia. The company provides telecommunications and information services, including mobiles, the internet, and pay television.
On the weekly chart, the stock has made a very close formation to Double Bottom chart pattern. Double Bottom chart pattern is a bullish reversal pattern which is formed after the stock makes a low (A$2.6 in June 2018) then rise to a certain level from where the selling kicks in (A$3.37 in August 2018) which throws the stock back around the previous lows (A$2.710 in December 2018). From here the buying comes in, and the stock again rises to the previous high level (A$3.41 in April 2019), and this time the stock is expected to breach the resistance which marks the breakout of the pattern, and a new uptrend is expected from hereon.
 Source: Thomson Reuters TLS Daily Chart
Currently, the stock is trading at A$3.380 as of 9th May 2019 and has already breached the resistance level and it is important for the stock price to sustain above the resistance level to validate the chart pattern.
Disclaimer
This website is a service of Kalkine Media Pty. Ltd. A.C.N. 629 651 672. The website has been prepared for informational purposes only and is not intended to be used as a complete source of information on any particular company. Kalkine Media does not in any way endorse or recommend individuals, products or services that may be discussed on this site. Our publications are NOT a solicitation or recommendation to buy, sell or hold. We are neither licensed nor qualified to provide investment advice.
