


Pilbara Minerals Limited (ASX:PLS) is an ASX listed metals and mining company based in West Perth, Australia. The company is focused on developing and exploring lithium and tantalum bearing minerals and also holds 100% stake in Pilgangoora Lithium-Tantalum project.
From September 2017, we have witnessed a sharp rise in the stock taking it from A$0.35 â A$0.38 all the way to the high of A$1.25 till the end of the same year. Thatâs a massive gain of more than 200% in almost four months.
At the peak of the rally, the Relative Strength Index (RSI) on the weekly chart had already given an overbought signal, stating the stock had risen at quite a high pace in a short duration of time which is interpreted as a âsoon to comeâ correction. At the peak of the trend, RSI was trading at 73.92 (reading above 70 states overbought zone).
After this massive rally, the stock made its first major correction which dragged it from the high of A$1.25 to the low of A$0.76. But this fall was indicated by RSI when it started to fall below 70 after the third week of the peak of the trend.
After this correction, the stock couldnât break its previous high, which indicates either a consolidation or a reversal in the trend. In this case, the stock reversed from the previous uptrend to a slow and steady downtrend. The stock started to decline in a falling channel, which is a bearish chart pattern.
In a falling/declining channel, the stock generally tends to trend down in a slow and steady manner. The falling channel is formed when a downtrend is continued, but it is contained within two falling trendlines, joining peaks and troughs of the trend. When the stock touches the upper trendline, it faces resistance and reverses back into the channel, and when it hits lower trendline, it tends to find support and hence bounces off into the channel.
Once the falling channel has been identified, one can also estimate the speed of the downtrend by analysing the steepness of the falling channel.
The stock took multiple support and resistance within the falling channel, which increases the reliability of the trendlines; hence, the falling channel becomes more effective. As of 23rd May 2019, the stock is still contained within the falling channel, stating a continued downtrend. However, if the current trendline resistance of A$0.83 â A$0.85 is breached with high volume, then it may reverse the downtrend.
On the downside, the stock has fallen quite a lot, and if the lower trendline gets breached, then it may accelerate the current downtrend.
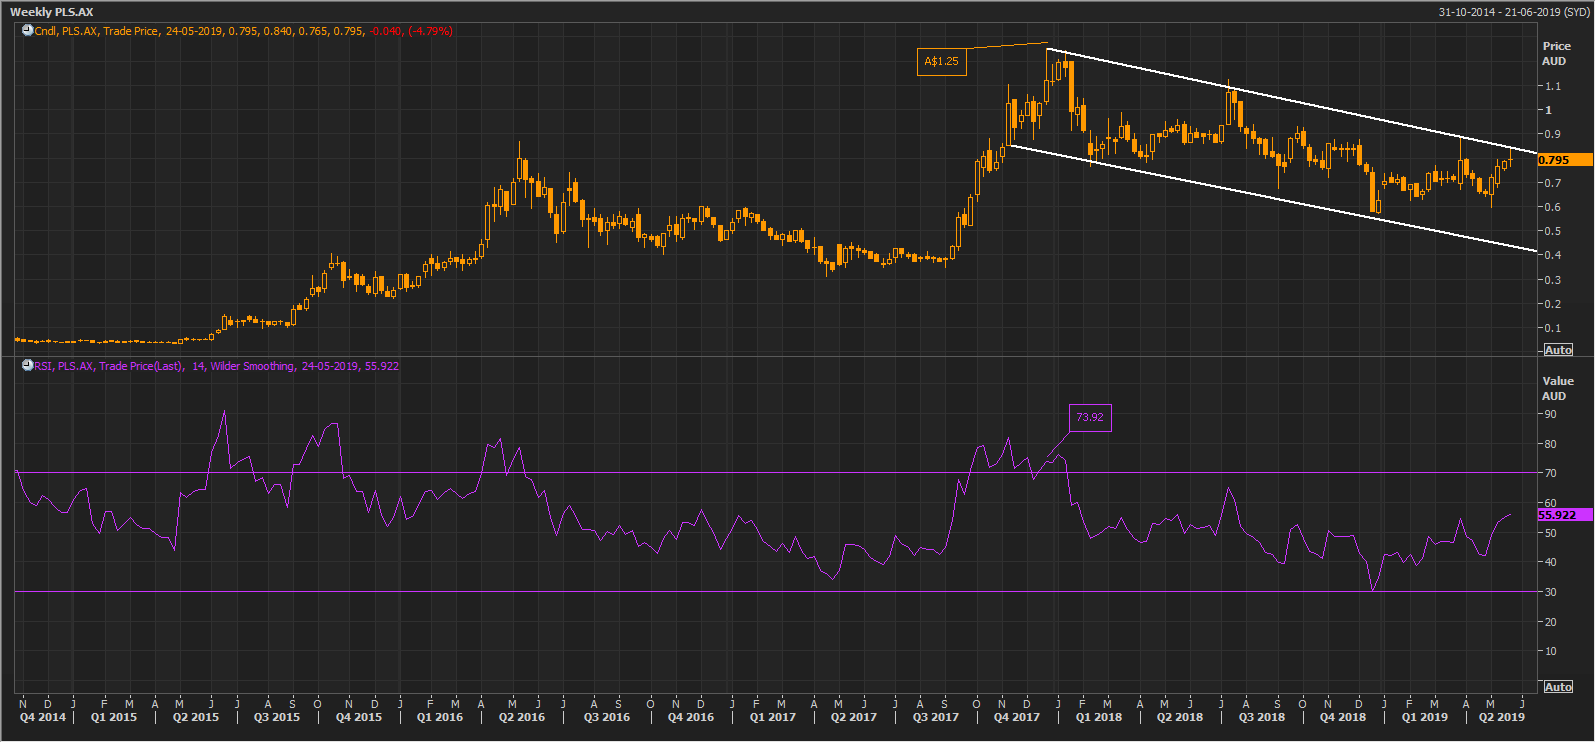 Weekly Chart of Pilbara Minerals (Source: Thomson Reuters)
Â
The company has a market capitalisation of A$1.54 billion, and the stock has registered a 52-week high and low of A$1.125 and A$0.57 respectively. The stock fell by 4.7% and closed at its intraday low of A$0.795 as on 23rd May 2019. The stock has delivered a negative return of 7.7%.
Disclaimer
This website is a service of Kalkine Media Pty. Ltd. A.C.N. 629 651 672. The website has been prepared for informational purposes only and is not intended to be used as a complete source of information on any particular company. Kalkine Media does not in any way endorse or recommend individuals, products or services that may be discussed on this site. Our publications are NOT a solicitation or recommendation to buy, sell or hold. We are neither licensed nor qualified to provide investment advice.
