


Iron ore prices inched up further in the international market. The CME index rose significantly to mark another 52-week high, which in turn, denotes a continuous streak of new highs in the international market. The same benchmark settled at US$96.56 (as on 21st May 2019) and inched up by 1.97% in the global market today to trade at US$98.59 (as on 22nd May 2019 AEST 4:51 PM).
The iron ore prices at the Dalian Commodity Exchange closed at RMB 717 (as on 21st May 2019), up by 0.77% as compared to its previous close of RMB 711.50 on 20th May 2019.
The supply shortage in the global market is pulling the strings of iron ore prices up; the iron ore inventory declined for the week ended 17th May 2019 and stood at 123.67 million tonnes. Post decline in inventory across the 35 Chinese ports, the shipment from Brazil and Australia marked another fall.
As per the data, eighty-four vessels arrived on Chinese ports between 12th to 18th May, carrying 11.97 million metric tonnes of iron ore, which marked a decline of 360,000 metric tonnes as compared to the previous week.
The delivery from the Australian ports declined by 260,000 metric tonnes for the same week, and deliveries from Brazilian ports declined by 430,000 metric tonnes, as per the market estimation.
Apart from such a shortfall in inventory, the steel inventory in China is declining as well, which in turn, is supporting the steel prices in the domestic market, and prompting mills to engage in the further raw material procurement process.
As per the data, the long steel inventories in Guangzhou provinces in China dropped by 7.15% as compared to the previous week and stood at 1.33 million metric tonnes (as on 22nd May 2019).
Apart from such demand and supply dynamics in the global market, the news of construction of three new blast furnaces in Jiangsu provinces (second largest steelmaking province) in China also uplifted the sentiments of the market participants over the higher consumption of iron ore in the Chinese steel industry and in turn, supported the iron ore prices.
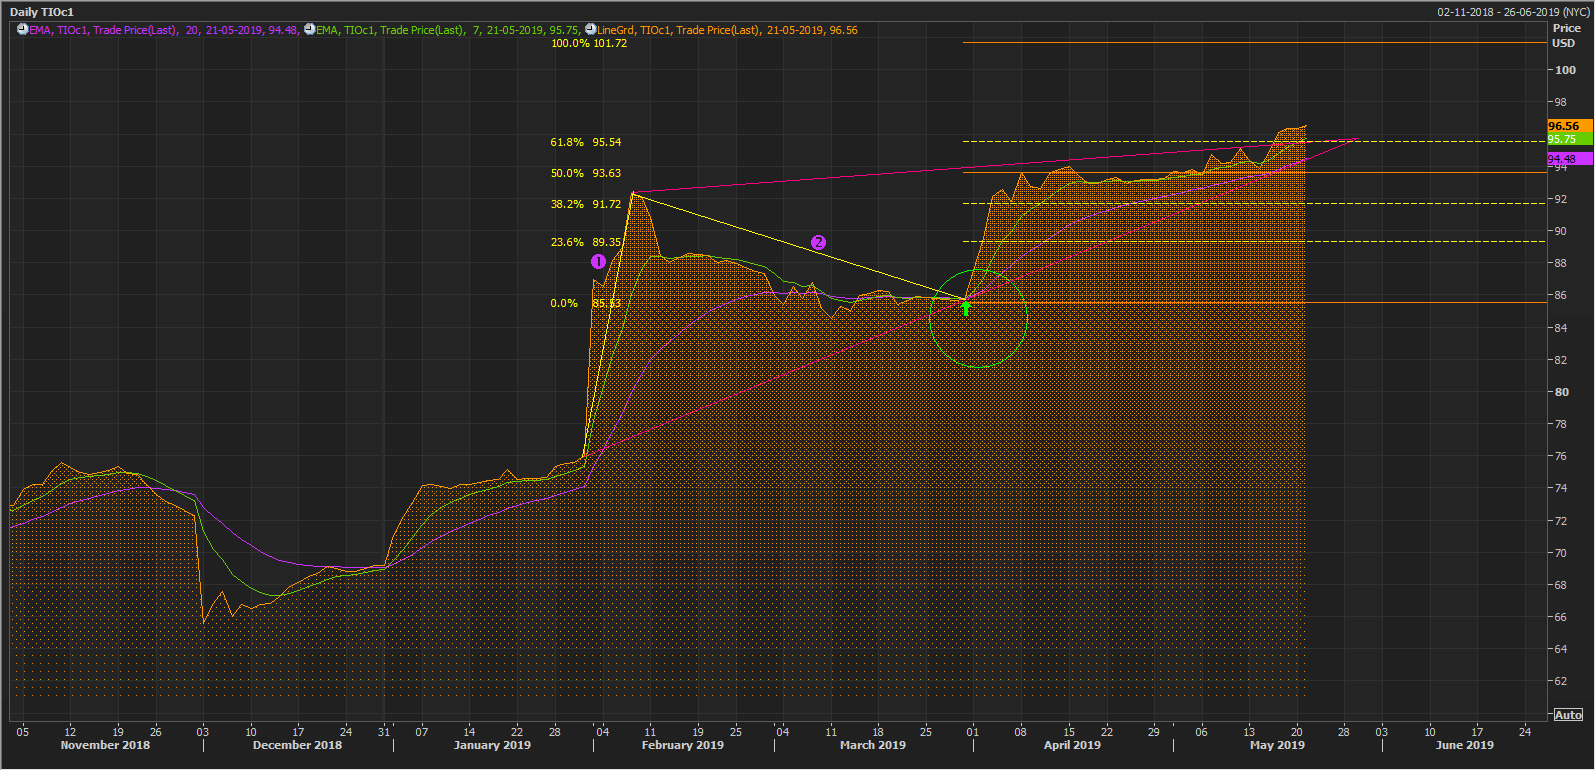 Source: Thomson Reuters; Iron Ore (CME) 62% Daily Chart
The current prices of the commodity are trading above the short-term 7-days and medium-term 20-days exponential moving averages, which are at US$95.75 & US$94.48 respectively. The daily chart marked a golden cross-over (Bullish signal) encircled with a green contour.
Thee prices recently broke the upward sloping ascending triangle formation on a daily chart made by pink lines. The recent rally in iron ore prices started from the level of US$76.03 (Dayâs close on 30th January 2019), denoted on the chart by a yellow line (1) and ended at US$92.29 (Dayâs close on 6th February 2019).
The price corrected from the level of US$92.29 to the level of US$85.70 (Dayâs close on 28th March 2019) represented on the chart by another yellow line (2). The upward wave corrected by almost 50%, which gave us a point to connect the point through Fibonacci Extensions.
The results of Fibonacci Extensions are as 23.6% (US$89.35), 38.2% (US$91.72), 50.0% (US$93.63), 61.8% (US$95.54), 100.0% (US$101.72).
Disclaimer
This website is a service of Kalkine Media Pty. Ltd. A.C.N. 629 651 672. The website has been prepared for informational purposes only and is not intended to be used as a complete source of information on any particular company. Kalkine Media does not in any way endorse or recommend individuals, products or services that may be discussed on this site. Our publications are NOT a solicitation or recommendation to buy, sell or hold. We are neither licensed nor qualified to provide investment advice.
